Neighborhoods with Highest Eviction Filing Rates have Lowest Levels of COVID-19 Vaccination

In the Lower Manhattan zip code 10006—home to One World Trade Center, the historic Trinity Church, and several luxury apartment buildings—almost 9 in 10 adults were fully vaccinated against COVID-19 by the start of June. Twelve miles north in the West Bronx (zip code 10457), a far different story played out, with just over 4 in 10 adults fully vaccinated. By contrast, those residents of the Bronx were far more likely to have received an eviction filing. Landlords filed 1,521 eviction cases in the West Bronx since March 15, 2020, compared to just 23 in the Financial District. Put differently: one in every 16 renter households in the West Bronx has received an eviction filing during the pandemic, compared to one in 58 in the Financial District. And the New York experience is not unique.
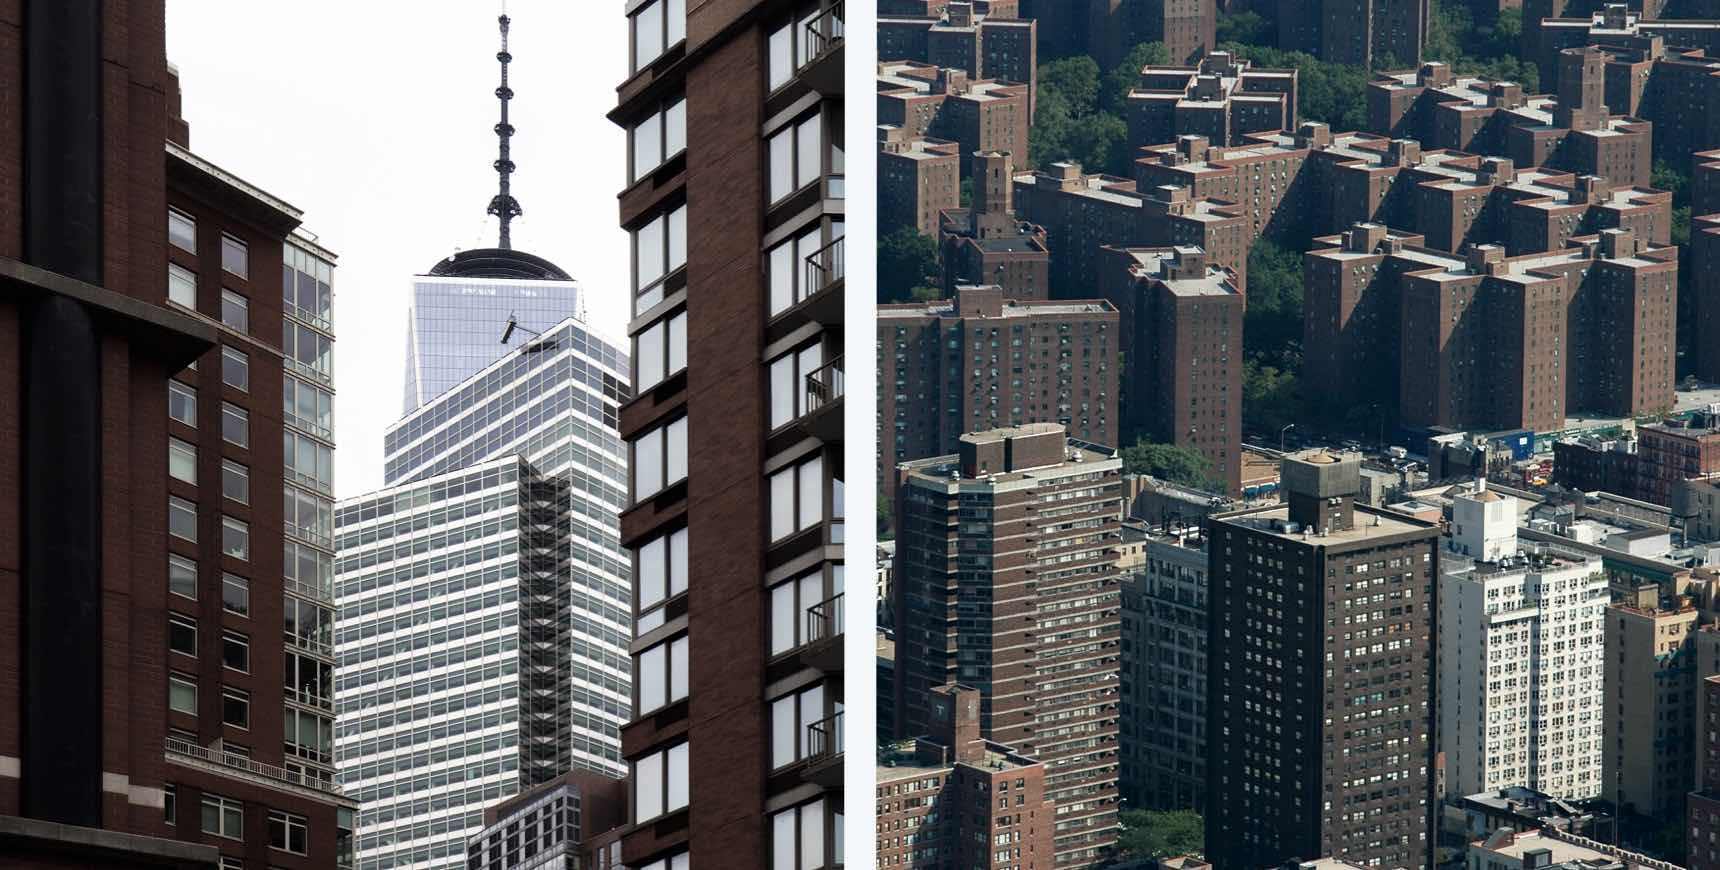
Left: Lower Manhattan. Right: The West Bronx.
The COVID-19 pandemic caused widespread unemployment, putting millions of U.S. families at risk of losing their homes. Fearing that a spike in eviction and homelessness would accelerate disease spread, the CDC issued a federal eviction moratorium. With that moratorium set to expire on June 30, we wanted to assess whether those at greatest risk of displacement were now protected against COVID-19 infection due to widespread vaccination. Where do vaccination rates stand in neighborhoods that have seen most eviction filings during the pandemic?
We found a pattern of higher eviction filing rates in neighborhoods with lower vaccination rates in every jurisdiction for which we were able to locate data. COVID-19 vaccines do not seem to be reaching those in high-eviction neighborhoods. Our findings suggest that those most at risk of being evicted are still at high risk of contracting and passing the virus.
To analyze the relationship between vaccination rates and eviction risk, we brought together vaccine distribution data collected from state and local governments1 and eviction filing data from the Eviction Tracking System. We identified nine cities with sufficient data: Austin, Dallas, Fort Worth, Houston, Indianapolis, Philadelphia, Phoenix, New York, and South Bend. Figure 1 depicts the relationship between eviction filing rates and the rate of fully vaccinated adult residents, by zip code, in each city. Each zip code is shaded according to its racial majority. We superimpose trend lines for each city, showing the linear relationship between the two rates.


In all cities we find that zip codes with higher eviction filing rates were more likely to have lower vaccination rates. The differences between neighborhoods were not small. In Phoenix, for instance, the average neighborhood with a low eviction filing rate since the start of the pandemic (under 5%), had a vaccination rate of 56%. By contrast, the average zip code with a high eviction filing rate (above 15%) had a vaccination rate of just 35%.
Patterns displayed in Figure 1 reflect racial disparities in both eviction risk and vaccine access. Black renters routinely face higher risk of being evicted, a pattern that has been maintained during the pandemic. Black and Latinx people are also much less likely to be vaccinated against COVID-19. The racial gap in vaccinations is decreasing, but Black and Latinx people still face challenges in getting access to vaccines. Figure 1 shows that the highest evicting zip codes in each city tend to be in communities of color, while most neighborhoods in the top-left of each panel—those with high vaccination rates and low eviction filing rates—tend to be majority-white.
Figure 2 puts these disparities into spatial perspective, showing two maps of Houston: a side-by-side comparison of eviction filing rates and vaccination rates across the city. Eviction filing rates were around 10% in two zip codes near Greenspoint, but vaccination rates were below 30% (compared to the mean of 48% for all zip codes in Houston). The neighborhood is made up of around 9% white, 30% Black, and 56% Latinx residents. By contrast, relatively few evictions have been filed during the pandemic in and around Downtown Houston, an area with some of the highest vaccination rates in the city. Although not all neighborhoods with low vaccination rates have high eviction rates, there is a strong correlation between the two rates.
In New York City, neighborhoods that are predominantly Black and Latinx have experienced not only higher rates of COVID-19, but also higher eviction rates. Our analysis suggests that the relationship between eviction filings and vaccination rates is just as strong, if not more so, and just as deeply linked with race.
A combination of lack of access and vaccine hesitancy drive disparities in vaccination rate. An estimated 30 million Americans who are willing to be vaccinated have not been; 28 million more say they probably or definitely will not be vaccinated for COVID-19. We also found geographic disparities both between and within cities. In the most vulnerable quarter of counties—defined by poverty rate, access to transit, and crowded housing—vaccination rates are as much as 7% lower than in the least vulnerable quarter of counties. These are the very same counties where previous Eviction Lab research has found a higher prevalence of eviction filings.
This strong correlation between high eviction filing rates and low vaccination rates presents a case for intervention. Areas with low levels of immunization may be at particular risk for COVID-19 resurgence, especially given the spread of more-contagious variants. A surge in eviction—which has been associated with COVID-19 transmission, infection, and mortality—would only increase that risk. From a public health perspective, improving access to vaccination in these high-eviction neighborhoods should be a priority, especially in light of the looming end of the CDC eviction moratorium. Simultaneously, legal aid groups and housing advocacy organizations should be targeting their efforts to these spaces. Increasing access to legal aid, emergency rental assistance, and vaccines in these neighborhoods may be critical in heading off an upturn in COVID-19 infections.
The COVID-19 pandemic is far from over, and while vaccination access is improving, it’s still limited in disadvantaged communities that are at greatest risk for eviction. The CDC eviction moratorium is, for many tenants behind on rent, the last remaining protection from the threat of displacement. As its expiration nears, few protections stand in the way of a family losing their home, and potentially contracting a life-threatening virus.
We published an updated version of this analysis in the journal Socius. That piece is available, open-access, here. You can also find replication code here.