Below are the aggregate data used in the Eviction Tracking System. We hope that you find new and productive ways to make use of them. When you do so, please cite as follows:
Peter Hepburn, Jacob Haas, Renee Louis, Adam Chapnik, Danny Grubbs-Donovan, Olivia Jin, Jasmine Rangel, Grace Hartley, and Matthew Desmond. Eviction Tracking System: Version 3.0. Princeton: Princeton University, 2026. www.evictionlab.org
Scroll below the data table to find code samples for using the data in your own applications. Please submit additional examples!
A data dictionary for these downloadable files can be found here.
Note: Some eviction filing data have a number of cases with missing or incorrect tract/zip code information. These cases will be listed in rows where the tract/zip is described as “sealed”. Values of filings by tract/zip may be underestimates as a result.
Note: As of August 2024, we have revised the census tracts in our baseline data to 2020 boundary definitions.
| Site | Prepandemic Baseline Years | Smallest Geography | Weekly Data | Monthly Data | Last Updated |
|---|---|---|---|---|---|
| All Cities | — | Census Tract / ZIP Code | Download CSV | Download CSV | 06/2026 |
| All States | — | Census Tract / ZIP Code | Download CSV | Download CSV | 06/2026 |
| Albuquerque | 2017-2019 | Census Tract | Download CSV | Download CSV | 06/2026 |
| Atlanta | 2018-2019 | Census Tract | Download CSV | Download CSV | 06/2026 |
| Austin | 2014-2019 | ZIP Code | Download CSV | Download CSV | 06/2026 |
| Boston | 2012, 2013, 2015, 2016 | Census Tract | Download CSV | Download CSV | 06/2026 |
| Bridgeport | 2017-2019 | Census Tract | Download CSV | Download CSV | 06/2026 |
| Charleston | 2016-2019 | Census Tract | Download CSV | Download CSV | 06/2026 |
| Cincinnati | 2012-2016 | Census Tract | Download CSV | Download CSV | 06/2026 |
| Cleveland | 2016-2019 | Census Tract | Download CSV | Download CSV | 06/2026 |
| Columbus | 2012, 2013, 2015 | Census Tract | Download CSV | Download CSV | 06/2026 |
| Connecticut | 2017-2019 | Census Tract | Download CSV | Download CSV | 06/2026 |
| Dallas | 2017-2019 | Census Tract | Download CSV | Download CSV | 06/2026 |
| Delaware | 2016-2019 | Census Tract | Download CSV | Download CSV | 06/2026 |
| Eugene | 2016-2019 | Census Tract | Download CSV | Download CSV | 06/2026 |
| Fort Lauderdale | 2014-2019 | Census Tract | Download CSV | Download CSV | — |
| Fort Worth | 2016-2019 | Census Tract | Download CSV | Download CSV | 06/2026 |
| Gainesville | 2017-2019 | Census Tract | Download CSV | Download CSV | 01/2026 |
| Greenville | 2016-2019 | Census Tract | Download CSV | Download CSV | 10/2025 |
| Hartford | 2017-2019 | Census Tract | Download CSV | Download CSV | 06/2026 |
| Houston | 2012-2015 | Census Tract | Download CSV | Download CSV | 06/2026 |
| Indiana | 2016-2019 | Census Tract | Download CSV | Download CSV | 06/2026 |
| Indianapolis | 2016-2019 | Census Tract | Download CSV | Download CSV | 06/2026 |
| Jacksonville | 2012-2016 | Census Tract | Download CSV | Download CSV | 06/2026 |
| Kansas City | 2012-2015 | Census Tract | Download CSV | Download CSV | 06/2026 |
| Las Vegas | 2016-2019 | Census Tract | Download CSV | Download CSV | 06/2026 |
| Miami | 2014-2019 | Census Tract | Download CSV | Download CSV | 04/2026 |
| Memphis | 2016-2019 | Census Tract | Download CSV | Download CSV | 01/2026 |
| Milwaukee | 2012-2016 | Census Tract | Download CSV | Download CSV | 06/2026 |
| Minneapolis-Saint Paul | 2012-2019 | Census Tract | Download CSV | Download CSV | 06/2026 |
| Minnesota | 2012-2019 | Census Tract | Download CSV | Download CSV | 06/2026 |
| Missouri | 2012-2015 | Census Tract | Download CSV | Download CSV | 06/2026 |
| Nashville | 2017-2019 | Census Tract | Download CSV | Download CSV | 06/2026 |
| New Mexico | 2017-2019 | Census Tract | Download CSV | Download CSV | 06/2026 |
| New Orleans | 2019 | Census Tract | Download CSV | Download CSV | 03/2026 |
| New York | 2016-2018 | ZIP Code | Download CSV | Download CSV | 06/2026 |
| Oklahoma City | -- | Zip Code | Download CSV | Download CSV | 06/2026 |
| Pennsylvania | 2016-2019 | ZIP Code | Download CSV | Download CSV | 06/2026 |
| Philadelphia | 2016-2019 | Census Tract | Download CSV | Download CSV | 06/2026 |
| Phoenix | 2015-2019 | Zip Code | Download CSV | Download CSV | 06/2026 |
| Pittsburgh | 2016-2019 | ZIP Code | Download CSV | Download CSV | 06/2026 |
| Portland | 2019 | Census Tract | Download CSV | Download CSV | 06/2026 |
| Providence | 2016-2019 | Census Tract | Download CSV | Download CSV | 06/2026 |
| Rhode Island | 2016-2019 | Census Tract | Download CSV | Download CSV | 06/2026 |
| Richmond | 2016-2019 | ZIP Code | Download CSV | Download CSV | 06/2026 |
| South Bend | 2016-2019 | Census Tract | Download CSV | Download CSV | 06/2026 |
| Southwest Oregon | 2016-2019 | Census Tract | Download CSV | Download CSV | 06/2026 |
| St Louis | 2012, 2013, 2015, 2016 | Census Tract | Download CSV | Download CSV | 06/2026 |
| Tacoma | 2017-2019 | Census Tract | Download CSV | Download CSV | 06/2026 |
| Tampa | 2016-2019 | Census Tract | Download CSV | Download CSV | 01/2026 |
| Virginia | 2016-2019 | ZIP Code | Download CSV | Download CSV | 06/2026 |
| West Palm Beach | 2014-2019 | Census Tract | Download CSV | Download CSV | 01/2026 |
| Wilmington | 2016-2019 | Census Tract | Download CSV | Download CSV | 06/2026 |
| Wisconsin | 2016-2018 | Census Tract | Download CSV | Download CSV | 06/2026 |
| Other Oregon Counties | -- | Census Tract | Download CSV | Download CSV | 06/2026 |
Sample code:
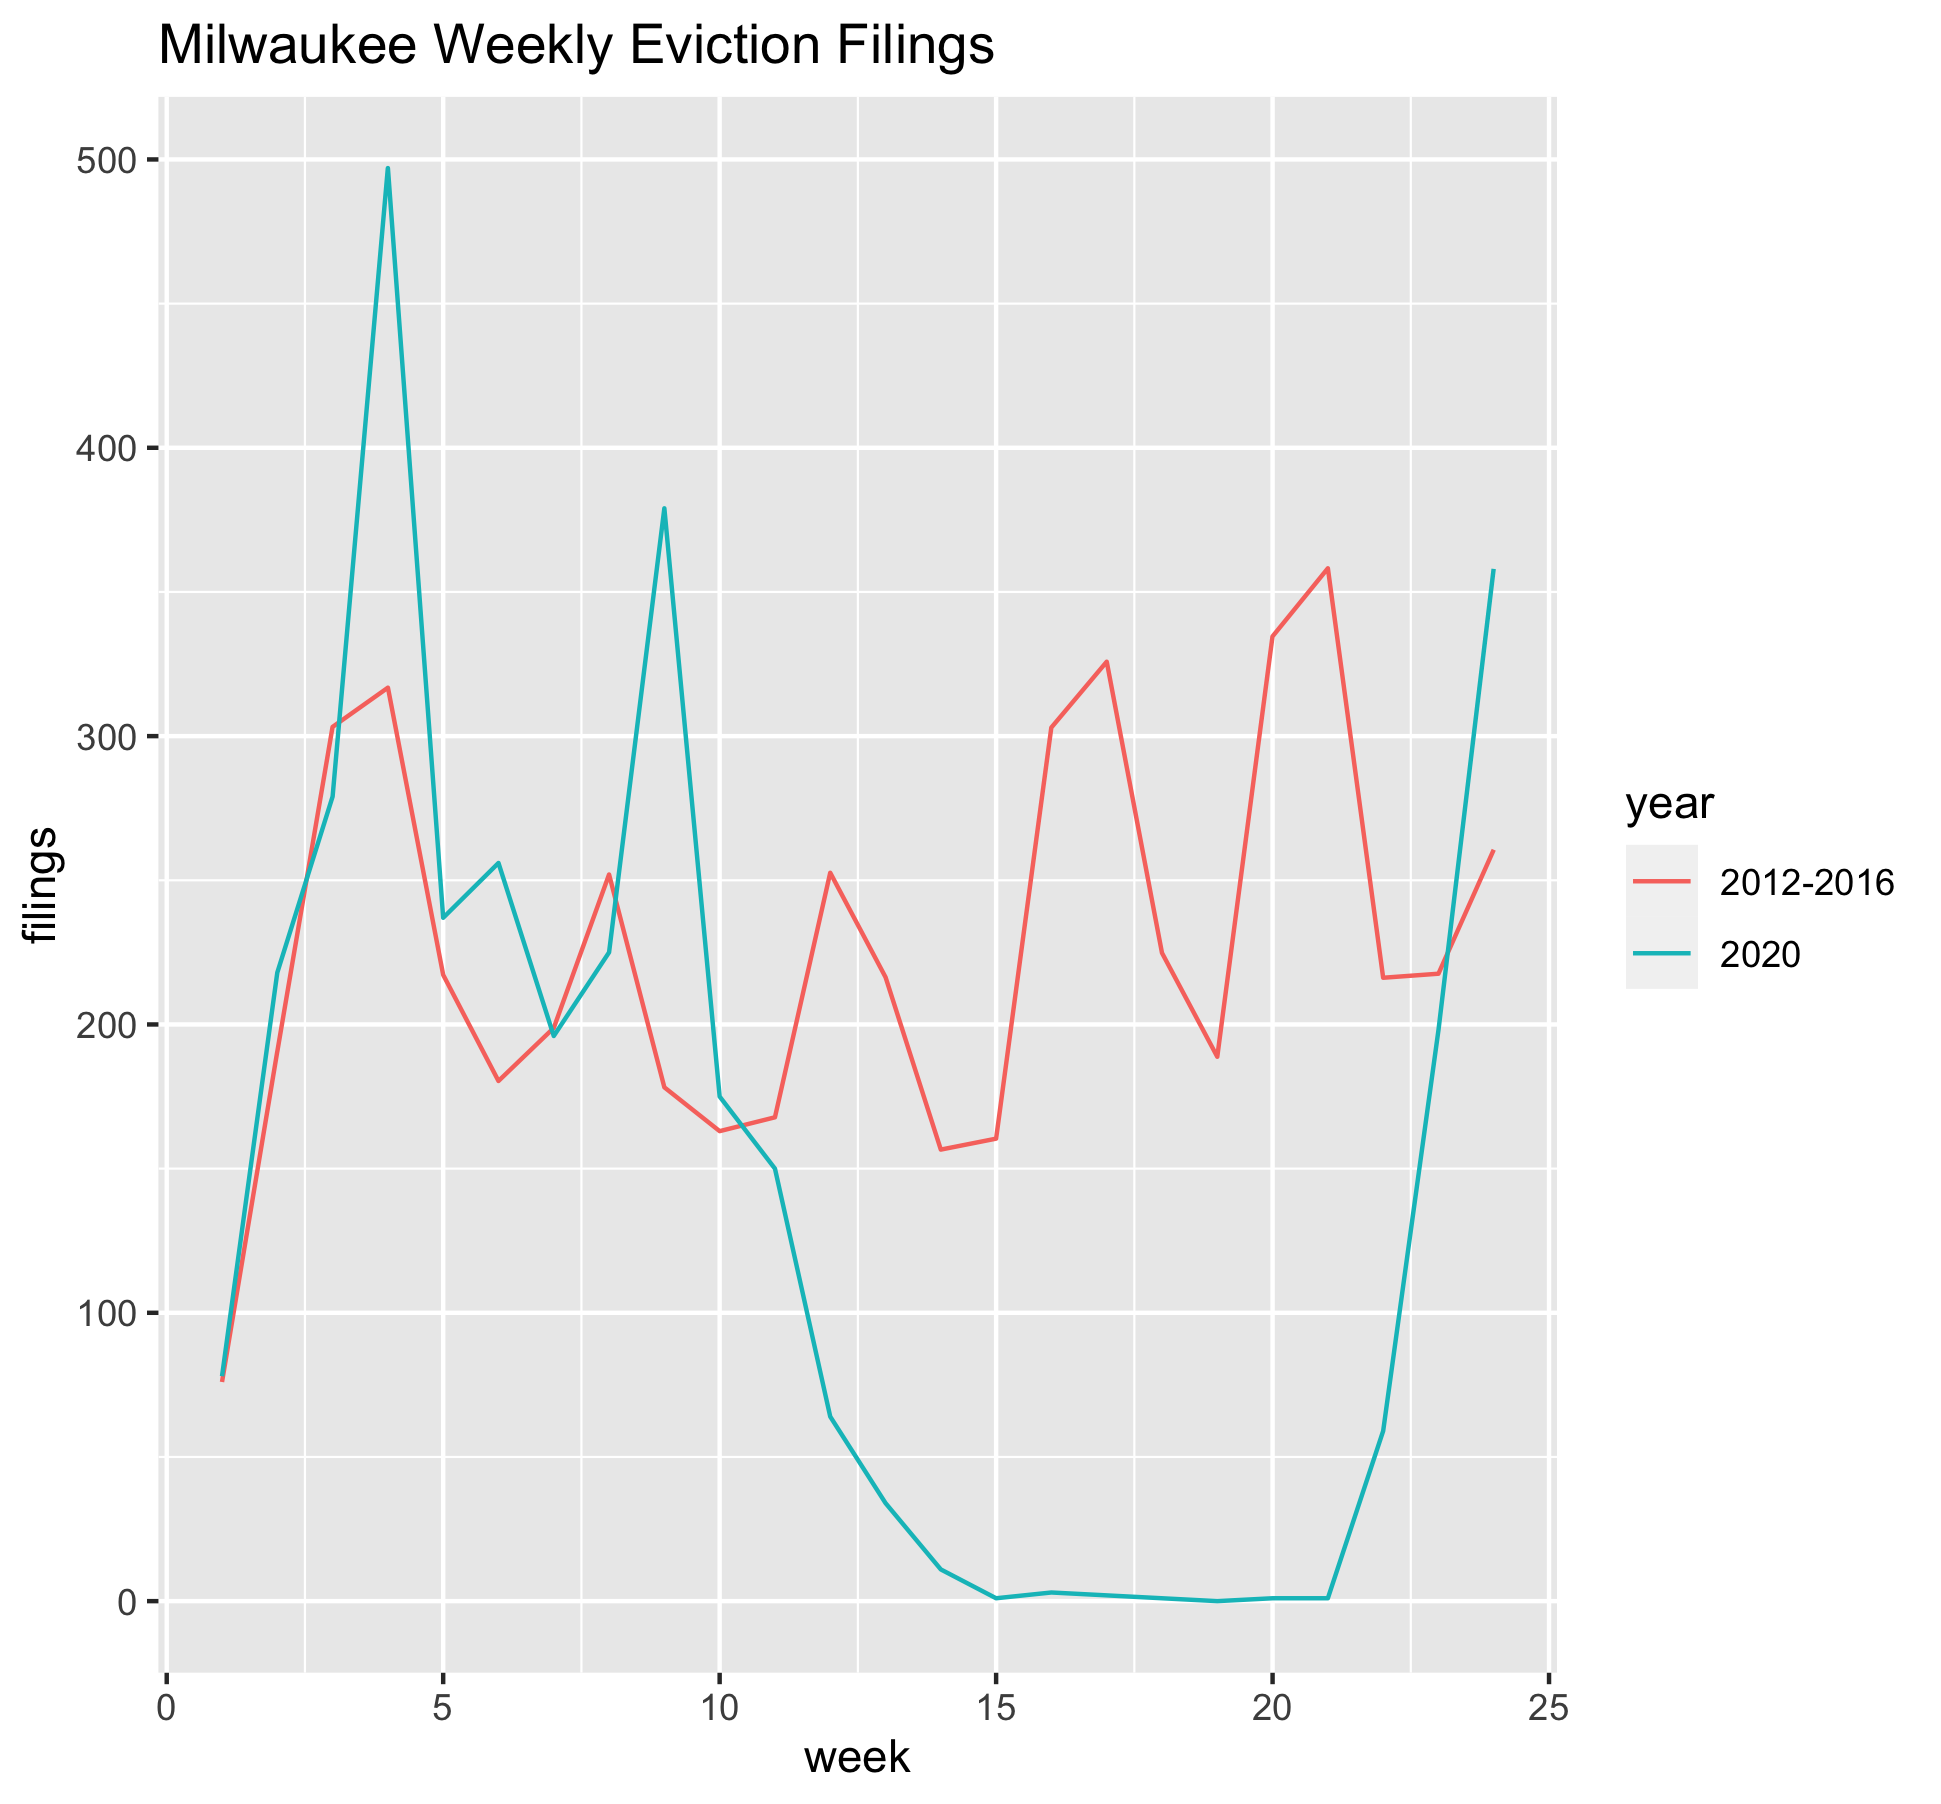
# Sample R code to plot weekly filings
# For Milwaukee until week 24 (06/13/2020)

# library(dplyr)
# library(tidyr)
# library(ggplot2)

mke_tract_week_2020 %>%
  group_by(week, week_date) %>%
  summarize(filings_2020 = sum(filings_2020),
            filings_avg = sum(filings_avg, na.rm = T)) %>%
  pivot_longer(cols = filings_2020:filings_avg,
               names_to = "year",
               values_to = "filings",
               names_prefix = "filings_") %>%
  mutate(year = recode(year,
                       avg = "2012-2016")) %>%
  ggplot(aes(x = week,
             y = filings)) +
  geom_line(aes(color = year)) +
  labs(title = "Milwaukee Weekly Eviction Filings")
Last Updated: June 12, 2026