Uncovering the Suburban Eviction Crisis


Eviction is often seen as a city problem. We tend to think of the eviction crisis as playing out in urban neighborhoods, both in high-poverty places where eviction is a constant threat and in gentrifying neighborhoods where long-term residents may be at growing risk of being forced out. This overlooks what’s going on outside of inner cities, leaving us blind to eviction patterns in suburban areas.
Our latest research explores eviction patterns in suburbs across the U.S. We find that eviction rates are, on average, lower in suburbs than in cities, but the difference is often small. Indeed, in one in every six metropolitan areas we analyzed, eviction rates were higher in the suburbs than the urban areas. Understanding suburban eviction patterns requires accounting for these differences, both between cities and between suburbs in the same metro area.
Suburban communities have changed tremendously over the past several decades. While suburbs are often imagined as predominantly-white, middle- or upper-class spaces, they are, in reality, increasingly diverse and home to millions of low-income tenants. Since at least 2010, the majority of poor people in the U.S. have lived in suburbs. Poor suburban renters face many of the same challenges as their city counterparts, including eviction.
We analyzed the records of 2.3 million eviction cases filed between 2012 and 2016 in 71 of the largest metropolitan areas across the U.S. to answer three questions. First, are suburban renters at higher, lower, or about the same risk of eviction compared to urban renters? Second, do the factors associated with high rates of displacement in cities also predict eviction in the suburbs? Third, do these patterns differ from city to city?
Read the Open Access Article at Urban Affairs Review:
Not all suburbs are the same. There’s a lot of variation in suburban eviction rates both between and within metropolitan areas. Patterns of eviction look different in Akron than in Atlanta, for example. Overall, eviction rates were typically higher in urban neighborhoods than in suburban neighborhoods, but that didn’t hold true everywhere. We found that suburban eviction rates were higher than urban rates in 12 of the 71 metro areas in our study. That was the case in several large cities, including Philadelphia, Houston, and Boston. In Figure 1, we show what this pattern looks like in Seattle, another of these cases. Eviction rates were low across the Seattle metropolitan area, but on average were twice as high in the suburbs as in the urban neighborhoods of Seattle, Tacoma, and Bellevue.
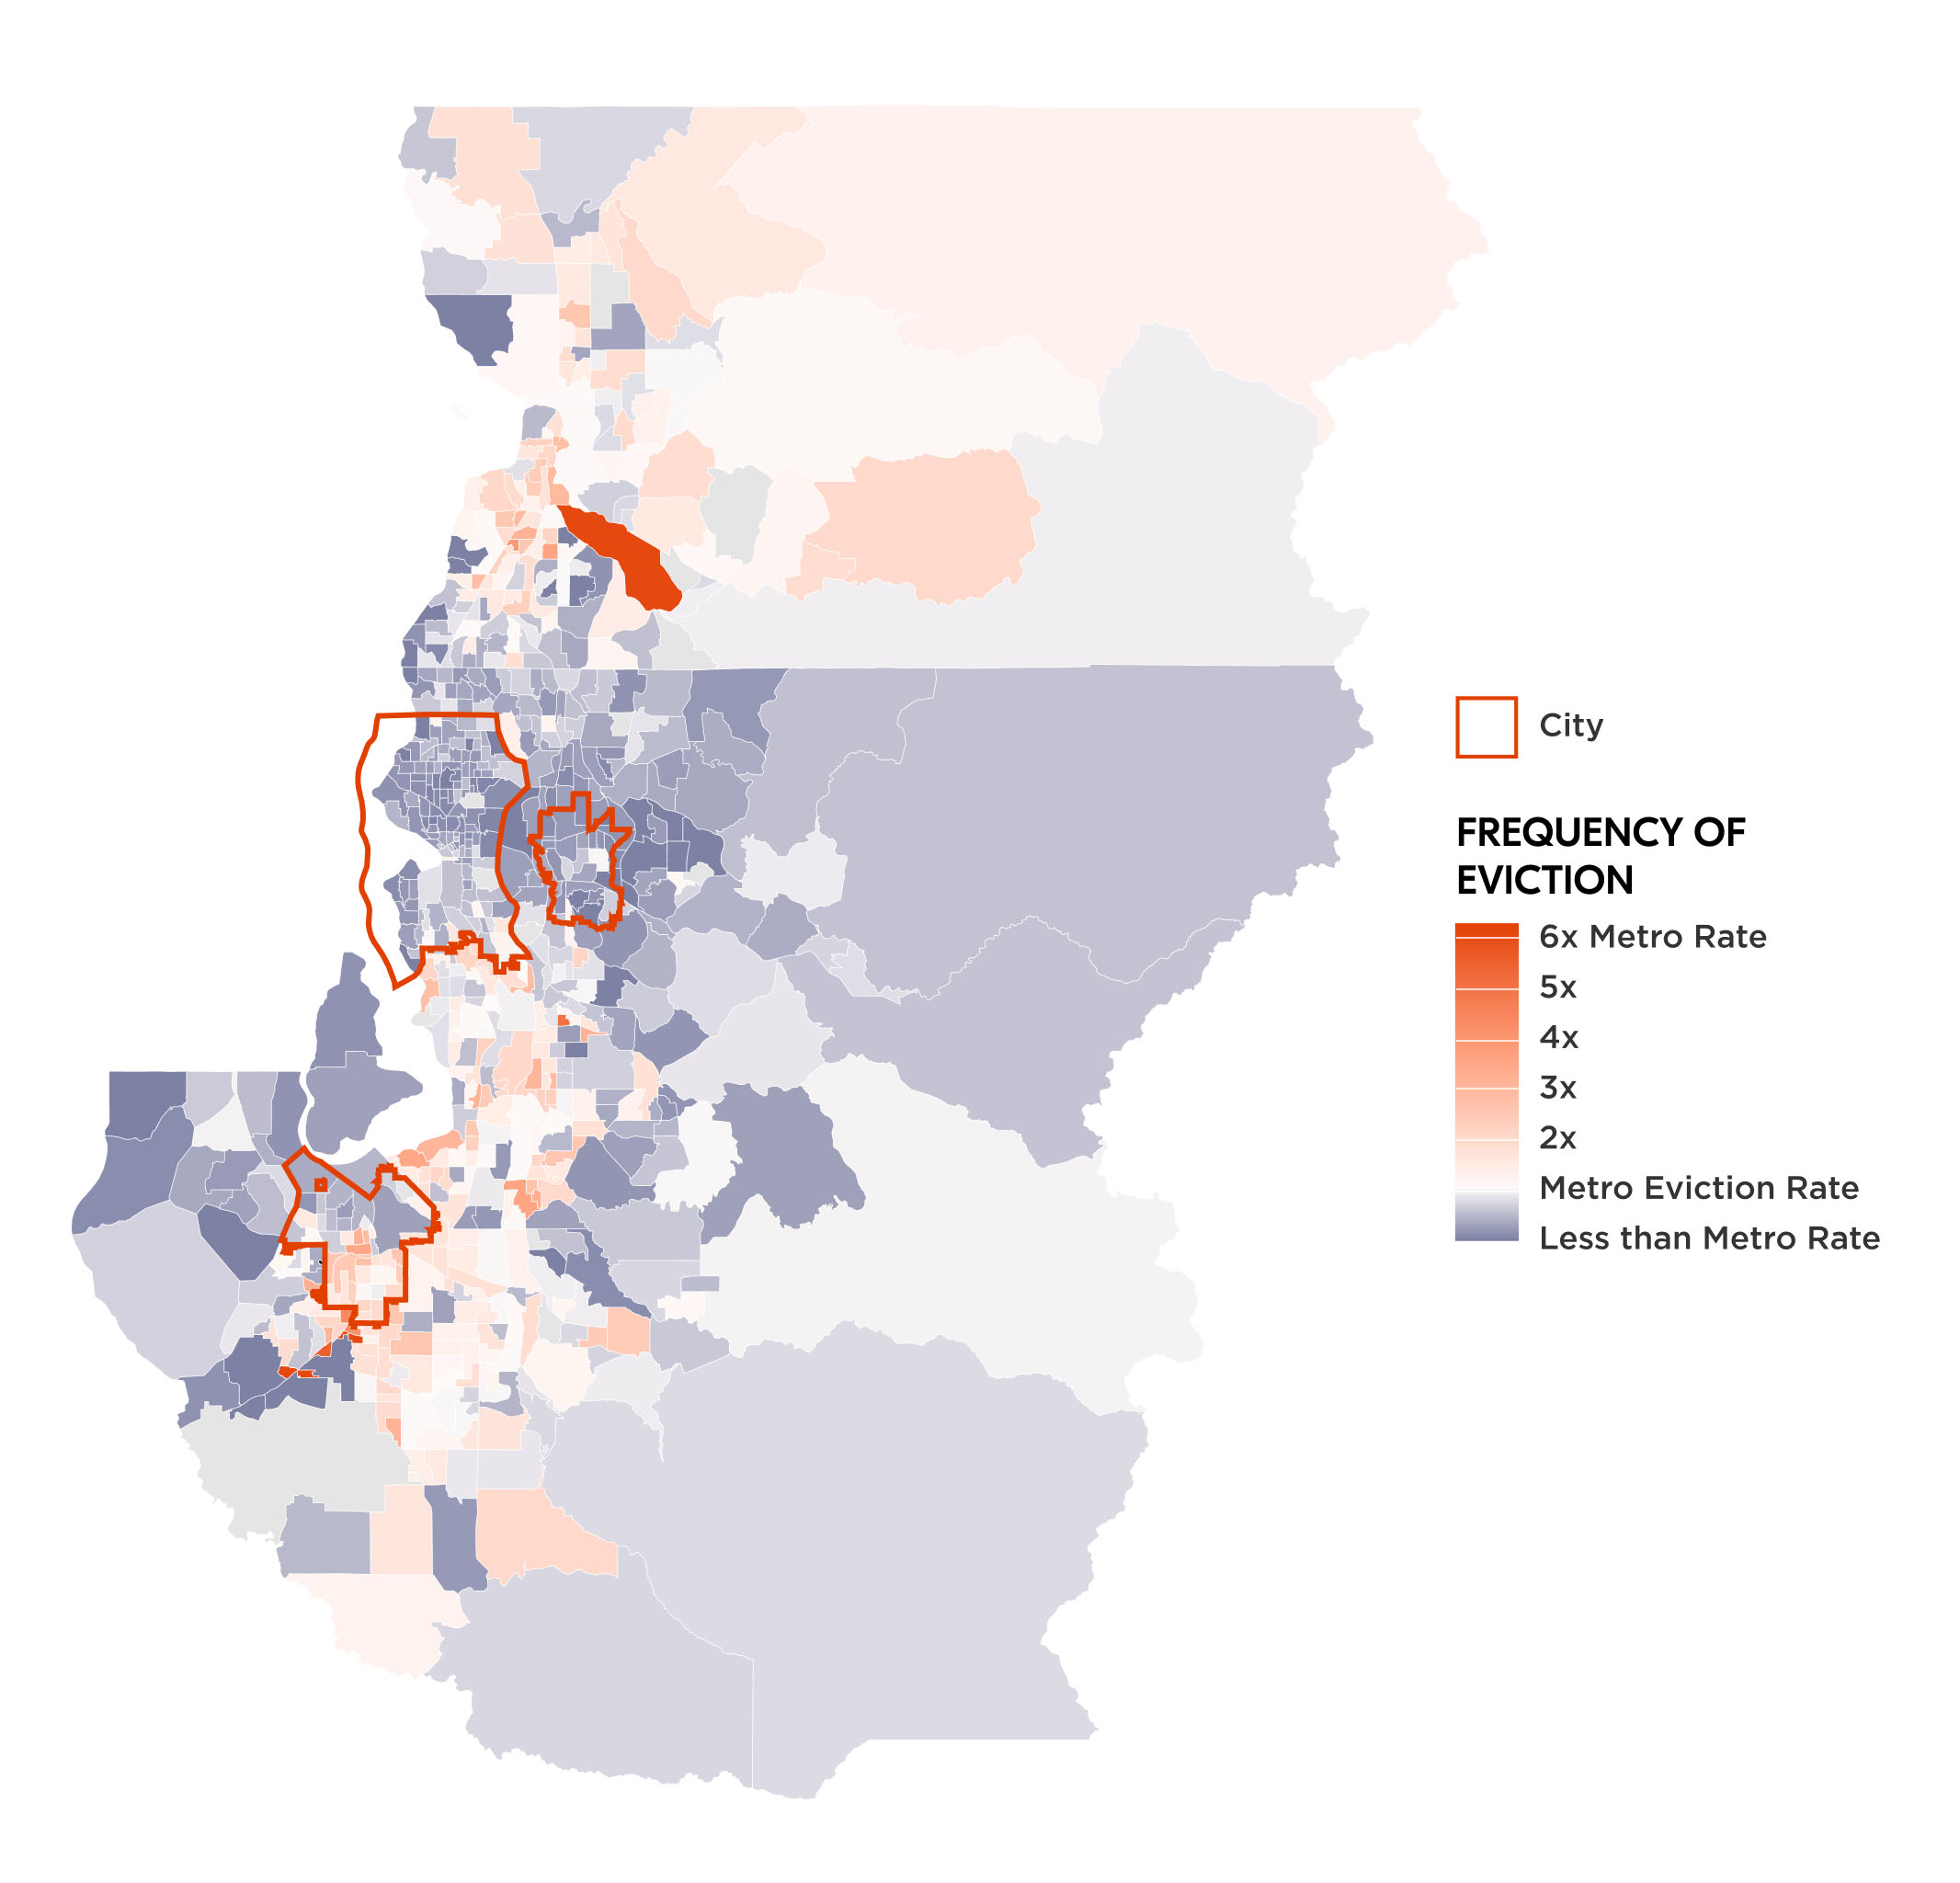
The greater concentration of eviction rates in the suburbs of Seattle stems from the economic renaissance and gentrification of greater Seattle from the 1990s onward. As the tech industry boomed, a growing number of well-paid individuals flocked to the urban neighborhoods of Seattle and Bellevue, particularly low-cost neighborhoods where lots of Black families lived. As lower-income households were increasingly pushed out, urban eviction rates dropped while suburban eviction rates rose.
Milwaukee provides an example of a stark urban-suburban split in the other direction, with much higher eviction rates in the city (see Figure 2). Between 2012 and 2016, the typical eviction rate in urban neighborhoods in Milwaukee was 4.01%, compared to 0.73% in the suburbs.
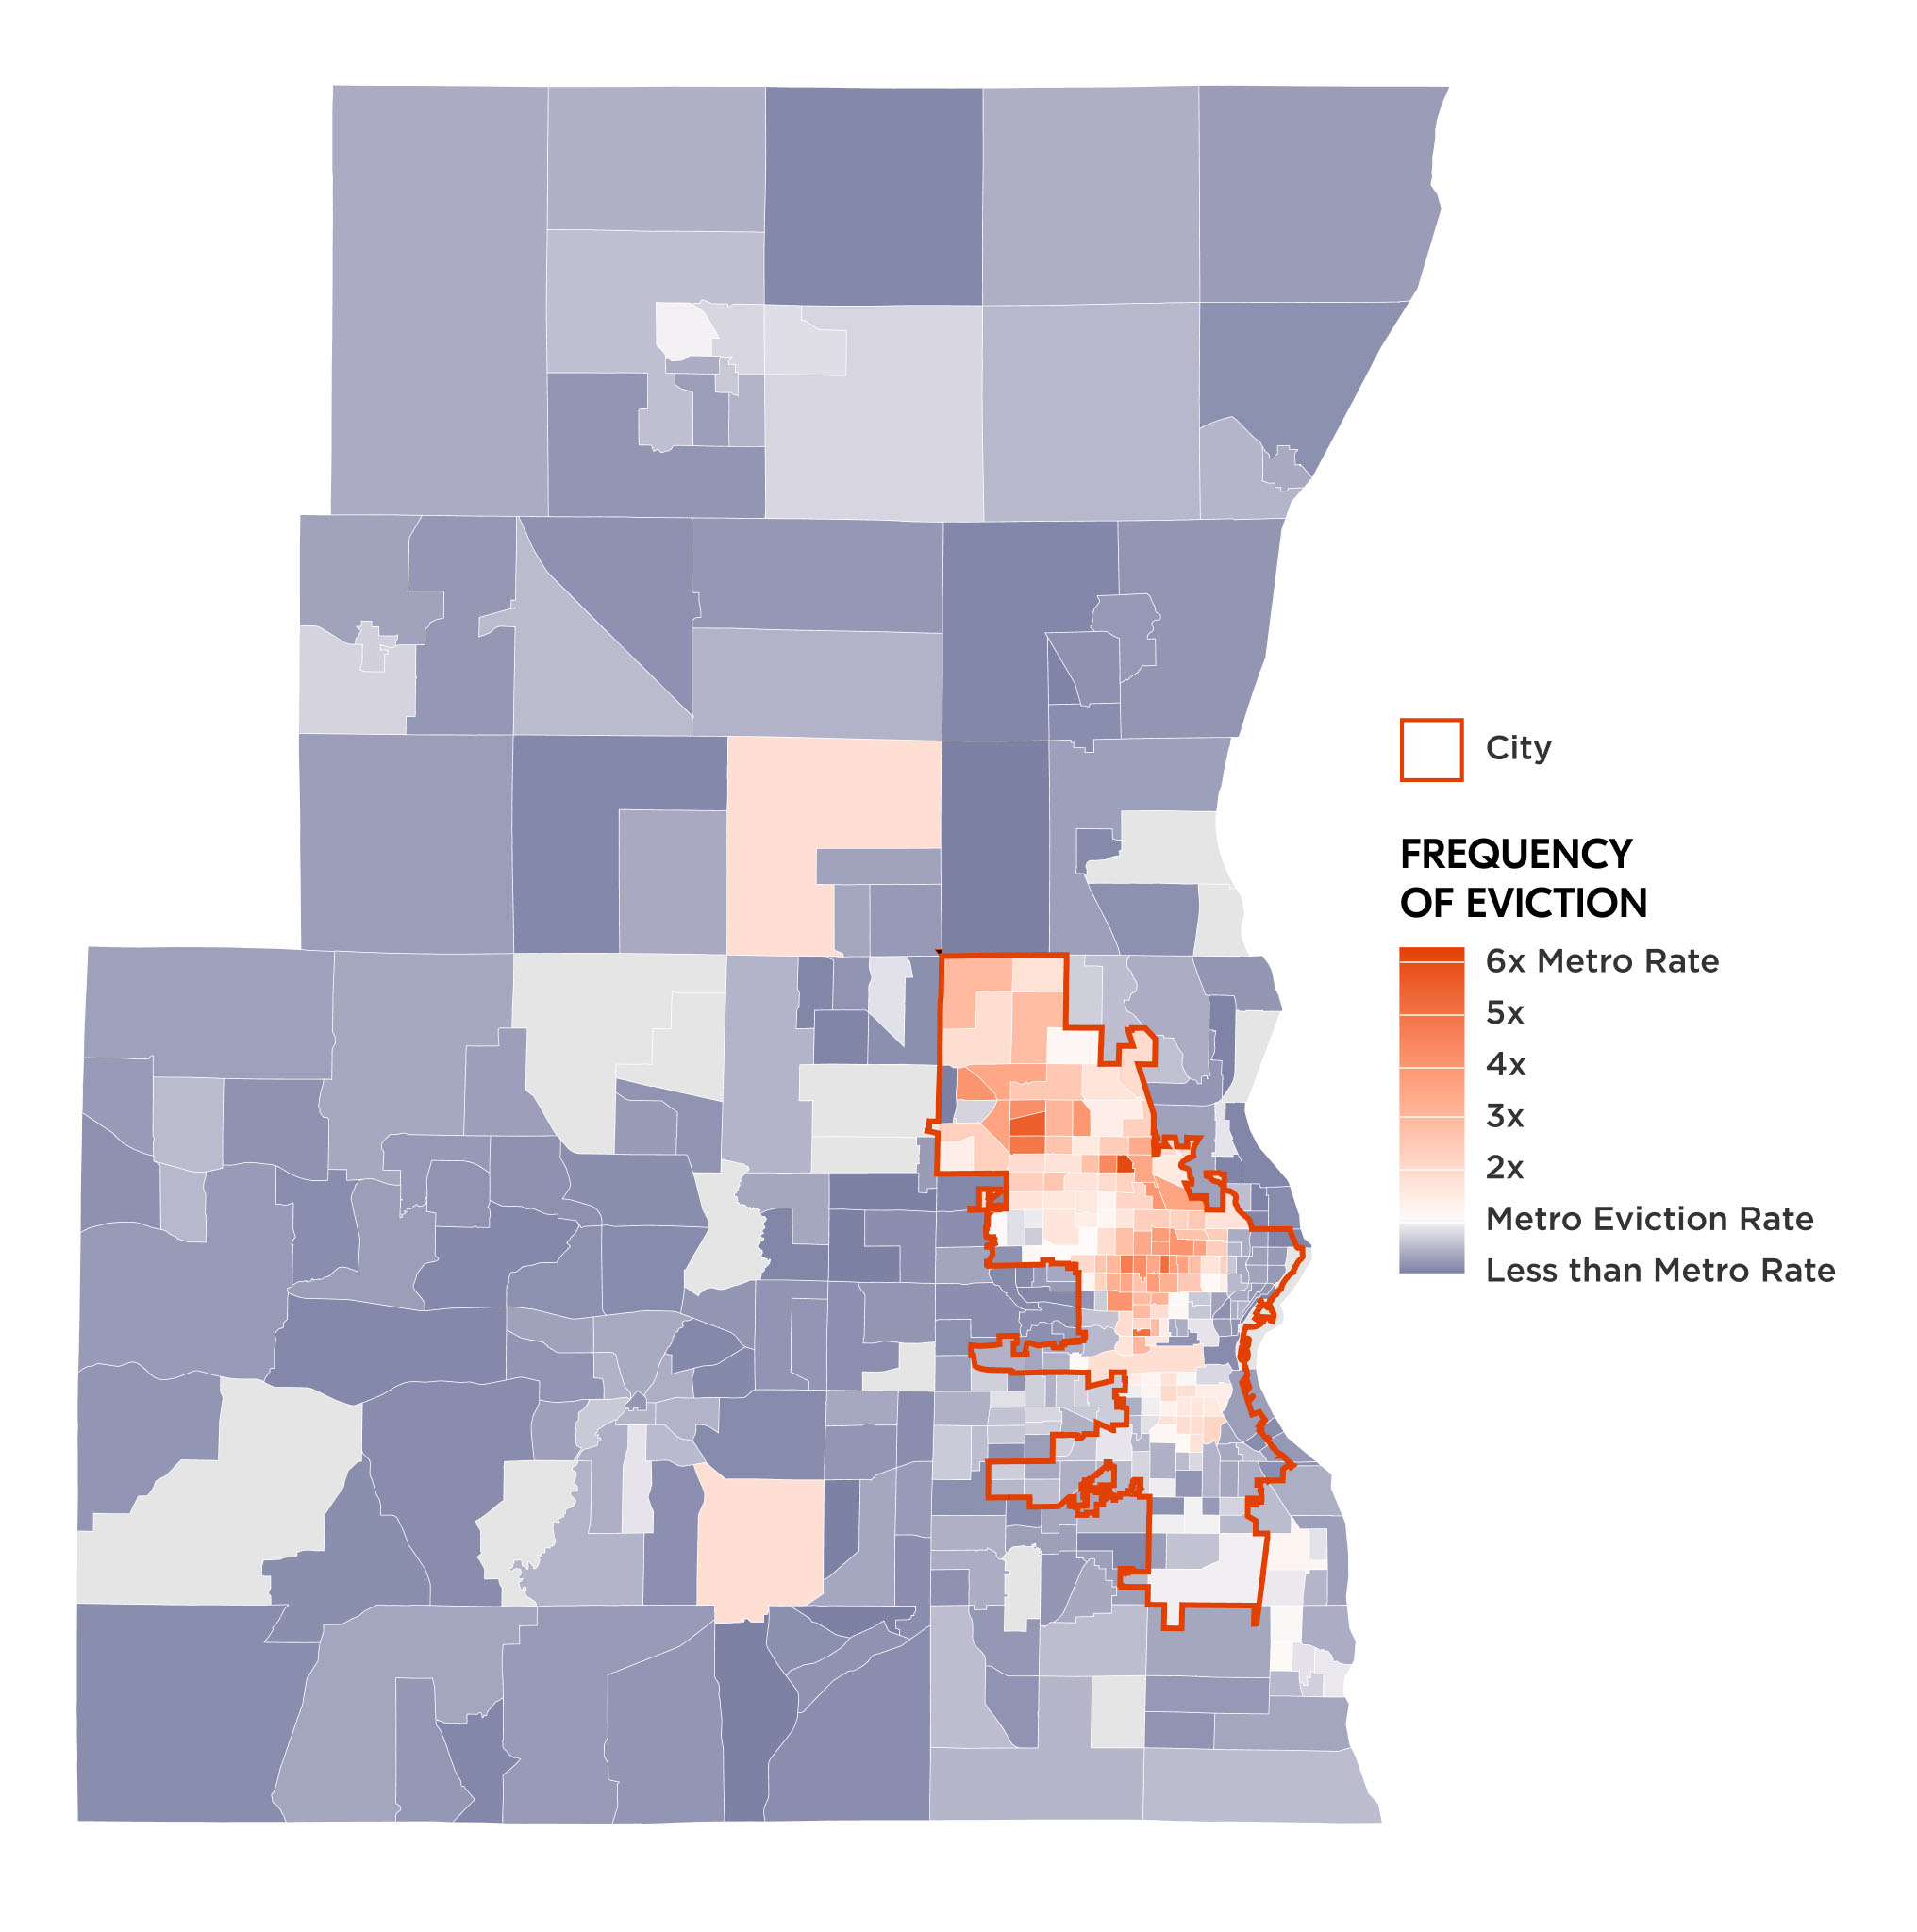
Current eviction patterns derive from a long history of racial segregation in Milwaukee, dating back to the Great Migration. Unlike other large Midwestern cities like Chicago or Pittsburgh, Milwaukee has not experienced extensive gentrification or rapid in-migration of professionals, meaning that there’s been less pressure pushing poor city residents out toward the suburbs. As such, poverty and evictions remain concentrated in the urban core, while the surrounding suburbs are characterized by a high concentration of white homeowners with more financial stability.
On average across all metro areas in our study, we found that eviction rates were higher in the typical urban neighborhood (3.19%) than in the typical suburban neighborhood (2.00%). Put another way, about one in every 30 urban renting families faced eviction each year, compared to one in every 50 suburban renting families.
These disparities in eviction rates, however, were explained by the fact that suburban neighborhoods still have more well-off households and white households than urban neighborhoods. We used regression methods to test how much of the difference in eviction rates was due to these socio-demographic differences. Once we controlled for neighborhood characteristics, we found no remaining difference in eviction rates between urban and suburban neighborhoods. In other words, if you had an urban and a suburban neighborhood that were otherwise identical—same income levels, racial composition, age of housing stock, and so on—those neighborhoods would have about the same eviction rate.
This doesn’t mean that the relationship between neighborhood characteristics and eviction rates plays out exactly the same in cities and suburbs. For example, poverty is correlated with eviction in both cities and suburbs. If you line up neighborhoods by poverty rate from lowest to highest, as you go up that line, the eviction rate goes up. But the relationship is a lot stronger in cities than in suburbs: as you go up the line, eviction rates rise faster (see Figure 3). Comparing two neighborhoods where more than one in five households was impoverished, the urban neighborhood had an eviction rate of 4.8%, while the suburban neighborhood’s rate was 3.6%. In the article, we also explore how these patterns varied depending on the age of housing in neighborhoods, the share of neighborhood residents who were Black, and the price of rent.

As poverty rises in the suburbs and affordability becomes an even bigger challenge, policies designed to ensure housing stability need to keep pace. This requires more regional cooperation and coordination between governments, social service providers, and housing advocates. Some suburban towns already have acute eviction crises, yet most legal aid and homeless shelters are centered in urban areas—not well-positioned for the many suburban tenants who are evicted each year. Similarly, city-level campaigns to provide legal representations or eviction diversion suffer if they end at the city limits. Even when localities do try to confront this growing problem, they are often stymied by the fragmented nature of suburban governance, where each suburb operates independently. Suburban tenants need state and regional support so they do not get left out.
This research also highlights the extent to which suburbs vary. Local policymakers need access to reliable and timely eviction data so that they can understand emerging trends in their area. The eviction crisis may play out quite differently in Kansas City, MO than in St. Louis. As such, local leaders need both national and region-specific analyses to keep families safely housed and to best target services where they are needed the most.
For further information about our analysis: