Preliminary Analysis: Eviction Filing Patterns in 2025

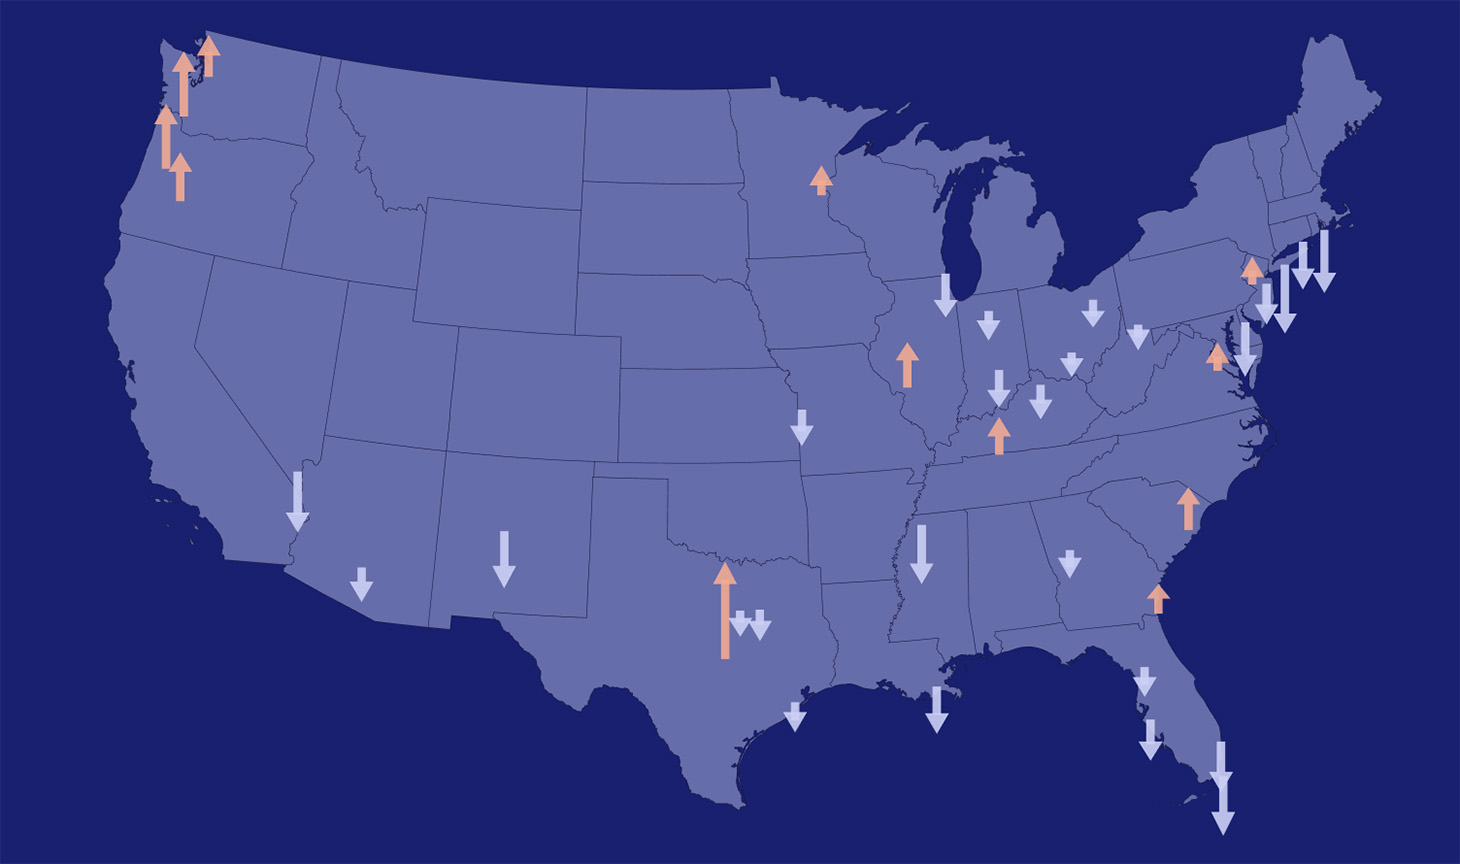 The above graphic shows eviction filings for sites we track, relative to their historical baseline. Arrows pointing up show sites with above baseline filings; arrows pointing down show the reverse.
The past year involved significant change and uncertainty, especially for low-income renting families. During the longest government shutdown in U.S. history, 42 million people were left without SNAP benefits for weeks, and the passage of the “One Big Beautiful Bill Act” stripped benefits for 2.5 million people permanently. The average amount of money low-income families have left after paying rent has hit an all-time low of just $210. On top of that, the federal immigration crackdown averaged 746 deportations a day, disrupting daily life for many immigrant households.
Families across the United States had to navigate all of these new obstacles against the backdrop of the long-running housing affordability and eviction crises. For example, in Minneapolis, immigration enforcement related raids forced many immigrants to stay home, losing work—with an estimated cost of $15.7 million in lost wages—and consequently struggling to pay rent. Experiencing an eviction can force people to spend more time in public spaces and then face a greater risk of being detained by ICE. These overlapping and mutually reinforcing pressures illustrate how eviction is both a cause and consequence of poverty.
The past year of eviction data allows us to assess the ongoing scale of housing instability. As we have seen in previous research, these trends reveal how local policy choices and persistent racial disparities undermine the stability of many renters in the United States. In this context, and despite some specific improvements in the state of the housing crisis, evictions remain widespread throughout the country.
This report relies on data collected through our Eviction Tracking System (ETS), which provides monthly updates on the volume of eviction case filings in 38 city areas and 10 states across the United States (you can find last year’s report here). While not nationally representative, these locations are home to roughly one-third of all renter households and provide a window into the state of housing instability throughout the country. In recent months, we expanded the Eviction Tracking System to track cases in the cities and suburbs surrounding Atlanta, GA, Tacoma, WA, Portland, OR, Eugene, OR, and Southwest Oregon. Our expansion into the Pacific Northwest means we now track at least one location in each census division of the country. These add up to: 18 sites in the South, 13 sites in the Midwest, nine sites in the Northeast, and eight sites in the West. Unfortunately, we lost access to eviction data in Greenville County, SC and no longer report monthly filings there.
Across all sites that we currently monitor, landlords filed 1.23 million eviction cases in 2025. This total was slightly lower than in 2024 (1.26 million cases) and marks the second year in a row of declining eviction filings (see Figure 1). Overall, eviction case filings in 2025 were 3.2% below the post-pandemic average.
While the total number of eviction filings across all sites was lower, this change was not consistent across the country. To better understand this variety, we talk about case filings compared to the post-pandemic average—the typical number of eviction cases filed annually in 2023 and 2024. Eviction filings were up relative to average in 14 of the 48 sites we track (Figure 2). In Travis County, TX (the greater Austin area), landlords filed 27% more eviction filings than normal in 2025. Filings were up substantially in each of our three Oregon sites, as well as in the areas of Charleston, SC, and Tacoma, WA. On the other hand, locations from Miami to Connecticut recorded far fewer cases than normal in 2025. The largest drop was in Bridgeport, CT (Fairfield County), where last year, landlords filed 20% fewer cases than average. It’s encouraging that more than two-thirds of the sites we monitor experienced fewer evictions than usual.
Still, a drop in the number of filings relative to the average can still mean a large number of households facing the risk of eviction. For example, Atlanta saw roughly 4% fewer filings than average in 2025, meaning there were roughly 5,600 fewer filings last year than in the preceding years. Despite that reduction, landlords still filed 144,000 eviction cases in 2025. That’s more than the number of eviction filings we recorded in New Mexico, Minnesota, Connecticut, Rhode Island, Delaware, and Wisconsin combined. Though the numbers aren’t quite as staggering, a similar story played out in the Houston, TX area: filings were down 5%, but that still meant 77,000 eviction filings.
To make comparisons that better account for the different population sizes—Atlanta being much larger than Tacoma, for example—we also report eviction filing rates: the number of eviction cases filed per 100 renter households. Across all the locations we track, the average eviction filing rate was 8.0%, which means that landlords filed roughly one eviction case for every 13 renter households in 2025. Like with absolute case volumes, though, we see significant variation in eviction filing rates across the country (Figure 3). Four sites—the areas of Atlanta, GA, Charleston, SC, Indianapolis, IN, and Memphis, TN—had filing rates that were at least double the national average. In Atlanta, landlords filed one eviction case for every four renters. Sites like South Bend, IN (9% filing rate), New Orleans, LA (8% filing rate), and Wilmington, DE (11% filing rate) had many fewer eviction cases filed than metro Atlanta, but they also have fewer renter households, and each ended the year with higher-than-average filing rates.
Scroll right to view full chart
Notably, most of the locations we track had eviction filing rates higher than in New York City. Despite its high rents and low vacancy rate, the eviction filing rate in NYC was only 5% in 2025. Why? A big reason is because New York has strong renter protections, demonstrating that high rents and a competitive market don’t make eviction inevitable. A similar pattern appears in Philadelphia, the sixth-largest city in the U.S., which has a filing rate smaller than all but three cities we track (Figure 3).
As we’ve demonstrated in previous analyses, Black renters are significantly overrepresented in eviction filings (Figure 4). Despite making up 28% of the renter population, we estimate that 39% of eviction filings in 2025 named a Black defendant. In contrast, 37% of eviction filings were against White defendants, far lower than their 45% of the renter population. Filings against Hispanic renters were approximately equal to their renter population. The disproportionate number of cases filed against Black renters is staggering in some cities. In greater Milwaukee, WI, 36% of the renter population is Black, but 66% of eviction filings in 2025 were against Black renters. Only 24% of renters in the Gainesville, FL area, are Black, but 53% of defendants on an eviction filing last year were Black.
This year’s data also reflect a familiar pattern: eviction cases are concentrated among a small number of landlords. These landlords, through a handful of buildings, drive a disproportionate number of renters into court (Figure 5). For example, more than half of the evictions filed in the areas of Albuquerque, NM, and South Bend, IN, were from just 100 buildings. We observed nearly 40% of filings from the top 100 buildings in Eugene, OR, Tacoma, WA, and Jacksonville, FL. In Atlanta, only 15% of filings came from the top 100 buildings, but this still amounted to 22,711 filings—more than the total number of cases filed across the entire state of Connecticut.
Despite some localized declines in 2025, the broader story of eviction remains far from optimistic. While filings fell in a handful of places, newly available data from previously untracked locations consistently show high, and often worsening, levels of eviction filing activity. As our data coverage expands, the numbers continue to demonstrate the scale and prevalence of housing instability across the entire country.
Evictions are only one measure of a broader housing affordability crisis. Nationally, the typical rent is 18% higher than it was five years ago, and a record high of 49% of renters are now rent burdened. There is no immediate federal relief in sight for an already strained system. Indeed, the President’s proposed budget for the coming year requests $3.8 billion in cuts to HUD funding for affordable housing and homelessness programs.
At the state and local level, however, there have been important steps to improve residential security for renters. The governor of Arizona recently announced $13.5 million in funding for eviction prevention and homelessness response. Tenant organizing is expanding in cities and suburbs alike, and many localities are gradually passing more tenant-friendly legislation. While new construction of affordable housing has cooled nationally, several cities in the Sun Belt—including Austin, Phoenix, and Tampa—are seeing increases in multifamily permitting. This may be a good sign for an area that currently faces some of the highest eviction rates in the country.
It is increasingly clear that frustration with housing unaffordability is widespread: 71% of Americans say that more affordable housing would improve their communities. The tension between widespread concern and persistent unaffordability points to a complicated and uncertain housing landscape ahead. For renters, the stability of the coming year will depend heavily on where they live and the strength of local tenant protections. We held our breath in 2025. We will see what shape our exhale takes in the year ahead.