New Data Release Shows that 3.6 Million Eviction Cases were Filed in the United States in 2018

The Eviction Lab’s newest data release shows that nearly 6 out of 100 renting households were threatened with eviction at least once during 2018. More than 3.6 million eviction cases were filed in that year, a similar number to the annual average of eviction filings between 2000 and 2018.
These new findings are part of a more extensive update to our existing national database of eviction lawsuits. While our original map was an effective tool in illuminating an invisible side of the country’s housing crisis, it was also limited, with some states and counties underrepresented, and others not represented at all.
This update to our National Eviction Map, available here, covers all 50 states and the District of Columbia more comprehensively. To achieve complete coverage across counties, we collected additional eviction records and annual reports on eviction filings from courts across the country. In the process, we expanded our coverage for two additional years, from 2016 to 2018.
Overall, an average of 3.6 million evictions were filed annually within the 19-year period that our data covers. The number of eviction filings grew steadily from 2000 to 2008, peaking in the years after the Great Recession. While filings have declined slightly from 2012 to 2018, filings during this period were still higher than they were from 2000 to 2005.
Despite aggregating more than 99 million eviction records and 30,000 county-level annual reports on eviction filings—representing an average of 2.6 million annual eviction filings—we were still missing reliable data for counties that were home to 33% of renting households. To overcome this challenge, we developed a statistical model that combined our different sources of data to estimate the annual prevalence of eviction filings and households threatened with eviction for the missing counties. Our models suggest that approximately 1 million more cases, on average, are filed each year than observed in the data we collected from the courts.
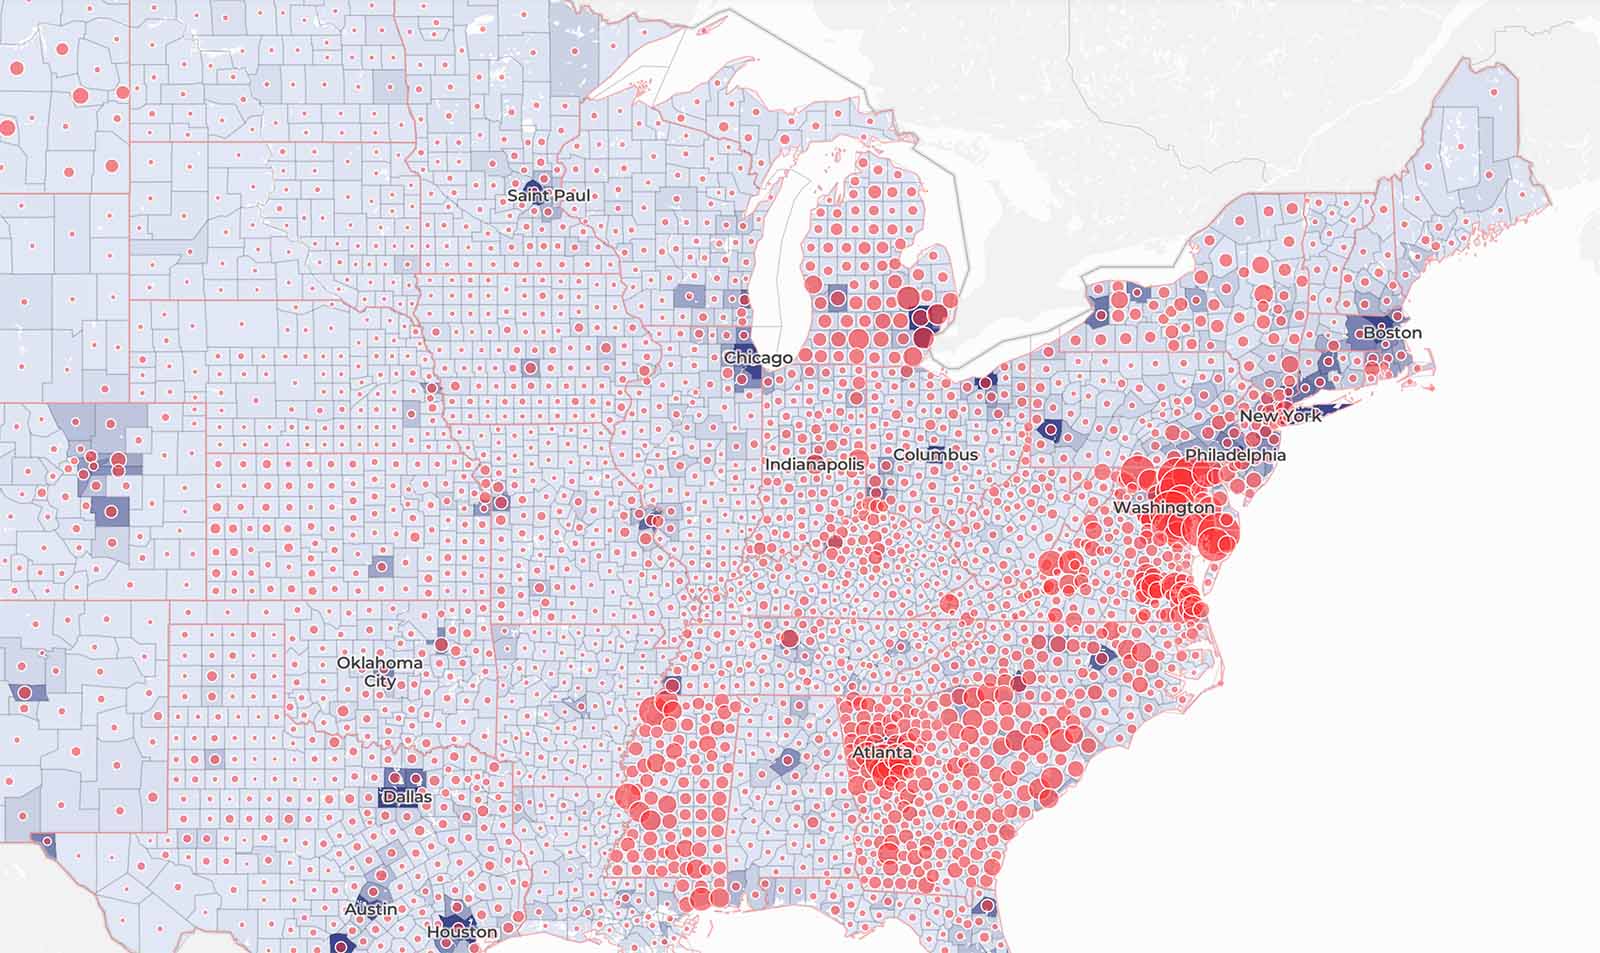
These estimates help confirm trends documented in our original map, including that eviction filing rates are consistently highest in the Southeastern United States. Some of the highest annual eviction filing rates are observed in Maryland, South Carolina, and Georgia, challenging conventional understandings of eviction risk as primarily a concern of high-cost or high-population metropolitan areas. The estimates also offer several new insights. First, although we estimated that 3.6 million eviction cases were filed in 2018 relative to 3.0 million in 2000, the eviction filing rate (number of filings per renting households) was lower in 2018 (7.8%) than in 2000 (8.4%). These seemingly contradictory trends are due to increases in the number of renting households during this period. This contributed to a curvilinear eviction filing rate, increasing from 2000 to 2008 before declining again in recent years. The rate of households threatened with at least one eviction filing followed a similar trend.
Second, these estimates allow users to know the number of unique households that receive at least one eviction filing a year, by using a new measure we call “households threatened with eviction.” With these data, we were able to show how state requirements that landlords provide notice to tenants before filing an eviction lawsuit, even if only a few days’ notice, are associated with lower eviction filings rates.
The ability to directly compare areas of high and low eviction filings within and across states can help evaluate the effects of state-level landlord tenant laws and county-level eviction policies. Because these data are statistical estimates, they include 95% credible intervals, which represent uncertainty around the estimates. We explain how these estimates differ from the original map and show how to interpret the estimates and credible intervals here.
The estimates of eviction filings and households threatened with eviction displayed on the map can be downloaded here. We published the creation of these estimates and the trends we discuss here in the Proceedings of the National Academy of Sciences. We provide a full description of our methodology here. The statistical code and full model output can be downloaded here.
We hope these new data help expand the ongoing debate surrounding access to affordable housing and facilitate research on the prevalence, causes, and consequences of eviction. More than that, we want this database to be a tool to empower our communities, housing advocates, and policymakers to solve the housing challenges renting households are experiencing across the country.