Preliminary Analysis: Eviction Filing Patterns in 2021

The last two years have witnessed the largest drop in eviction filings on record. Last year, millions of renters avoided the threat of eviction thanks to expanded legal protections and new social safety net programs, many of them enacted as part of the American Rescue Plan. For the second year in a row, eviction filings remained well below normal, pre-pandemic levels. The federal government intervened in the eviction crisis in a serious and unprecedented way. Our data show that that intervention has paid off.
This reduction in eviction filings varied between jurisdictions, over the course of the year, and depending on neighborhood demographics. Low-income and majority-Black neighborhoods that normally see a disproportionate share of eviction cases experienced the largest absolute reductions in filings. Public policies enacted in response to the pandemic have led to a sustained reduction in housing instability and were effective in helping those most in need.
Since the start of the COVID-19 pandemic, we have been tracking eviction filings in a set of jurisdictions across the country. The six states and 31 cities included in the Eviction Tracking System (ETS) are home to roughly a quarter of all renters nationwide. Eviction filings fell sharply at the onset of the pandemic but increased in the later months of 2020, still ending the year lower than typical pre-pandemic levels. In this post, we update our previous research to analyze the second calendar year of the pandemic.
Across all sites tracked by the ETS, 434,304 eviction cases were filed between January 1 and December 31, 2021. We compare what we observed in 2021 to normal conditions: the number of cases filed in a typical year prior to the pandemic in the same set of states and cities.1 This allows us to provide an estimate of the number of “avoided” evictions that were never filed. This estimate is conservative because the financial effects of the pandemic put at least twice as many renters as normal at risk of eviction. Given economic hardship resulting from the pandemic, we would have expected far more eviction cases to be filed in 2021 than were filed in 2019. But the opposite happened.
In a typical year, roughly 865,000 eviction cases were filed in the 31 cities and 6 states that make up the ETS. In 2021, 434,304 eviction cases were filed, 50.3% of historical average. Put another way, we observed nearly 430,000 fewer eviction cases than normal across the areas that we track. Using regression methods and historical data for the rest of the country, we estimate that nationwide at least 1.36 million eviction cases were prevented in 2021.
Reductions in eviction filings were much larger in some places than in others. In Figure 1 we plot eviction filings in 2021 relative to normal levels for all cities in the ETS.
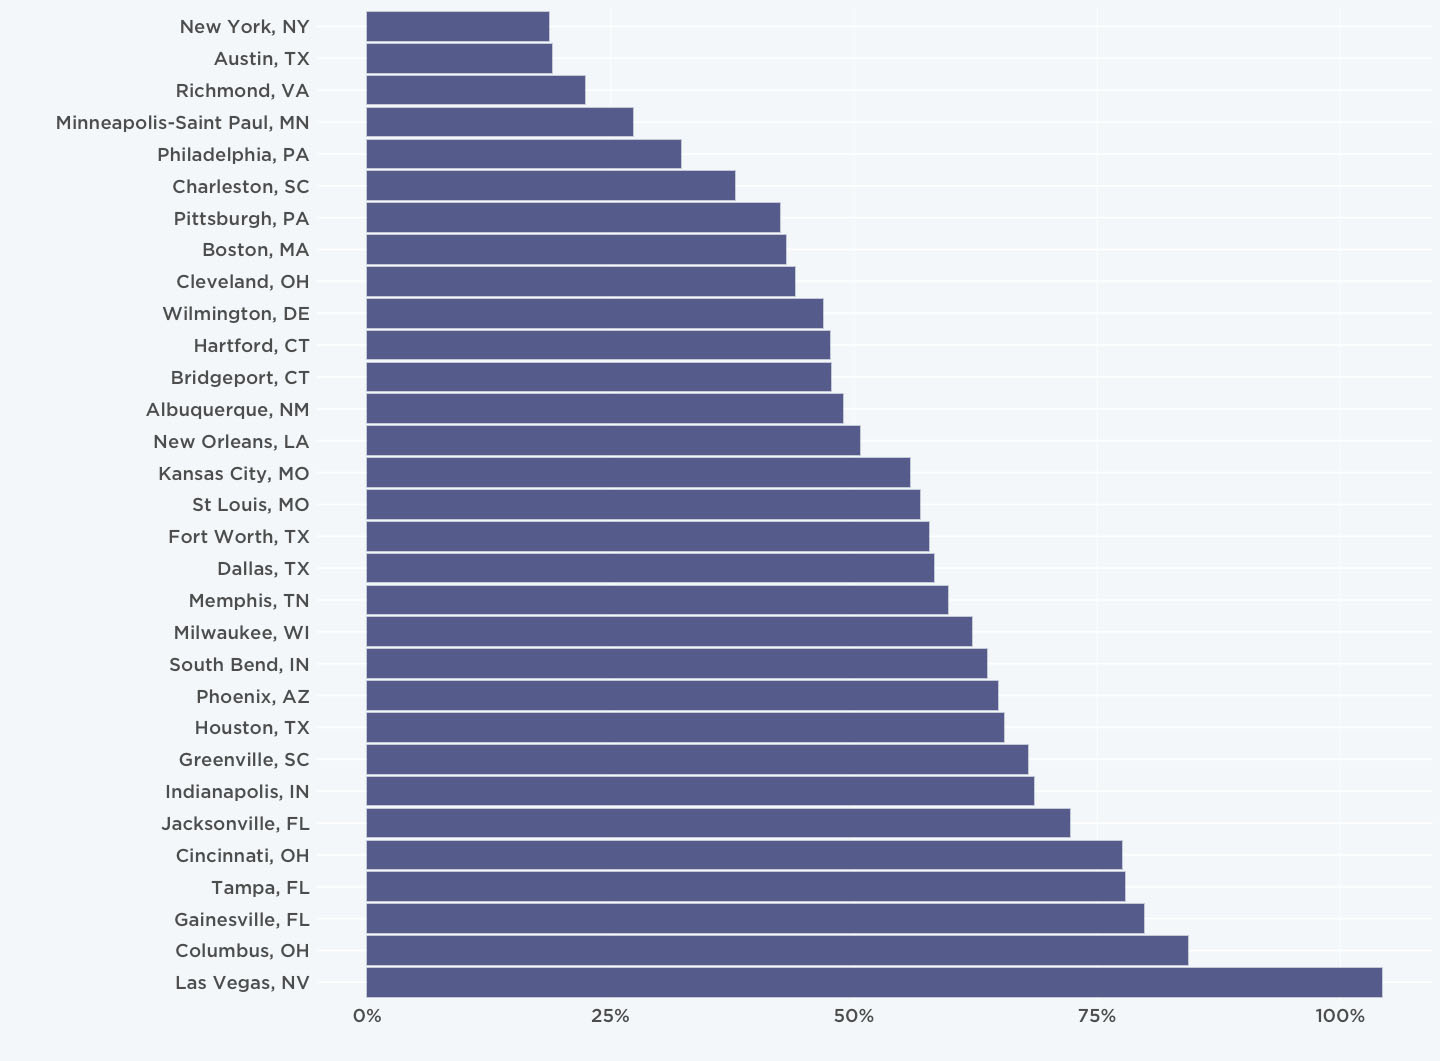
Over the course of 2021, eviction filings fell below historical average in all but one of the cities we monitor. Filings in New York City, Austin, TX, and Richmond, VA all remained below 25% of historical average. Last year, there were nearly 184,000 eviction cases avoided in New York City alone. Bucking this general trend is Las Vegas, NV, where reductions in tourism affected the large number of renters working in the service sector. In 2021, this city saw about five percent more eviction filings than we would expect to see in a typical year. But in all other cities we observed, eviction filings last year were below historical averages. Renting families in cities as diverse as Albuquerque, Wilmington, Boston, Charleston, and Austin were served with half as many eviction filings as they usually are.
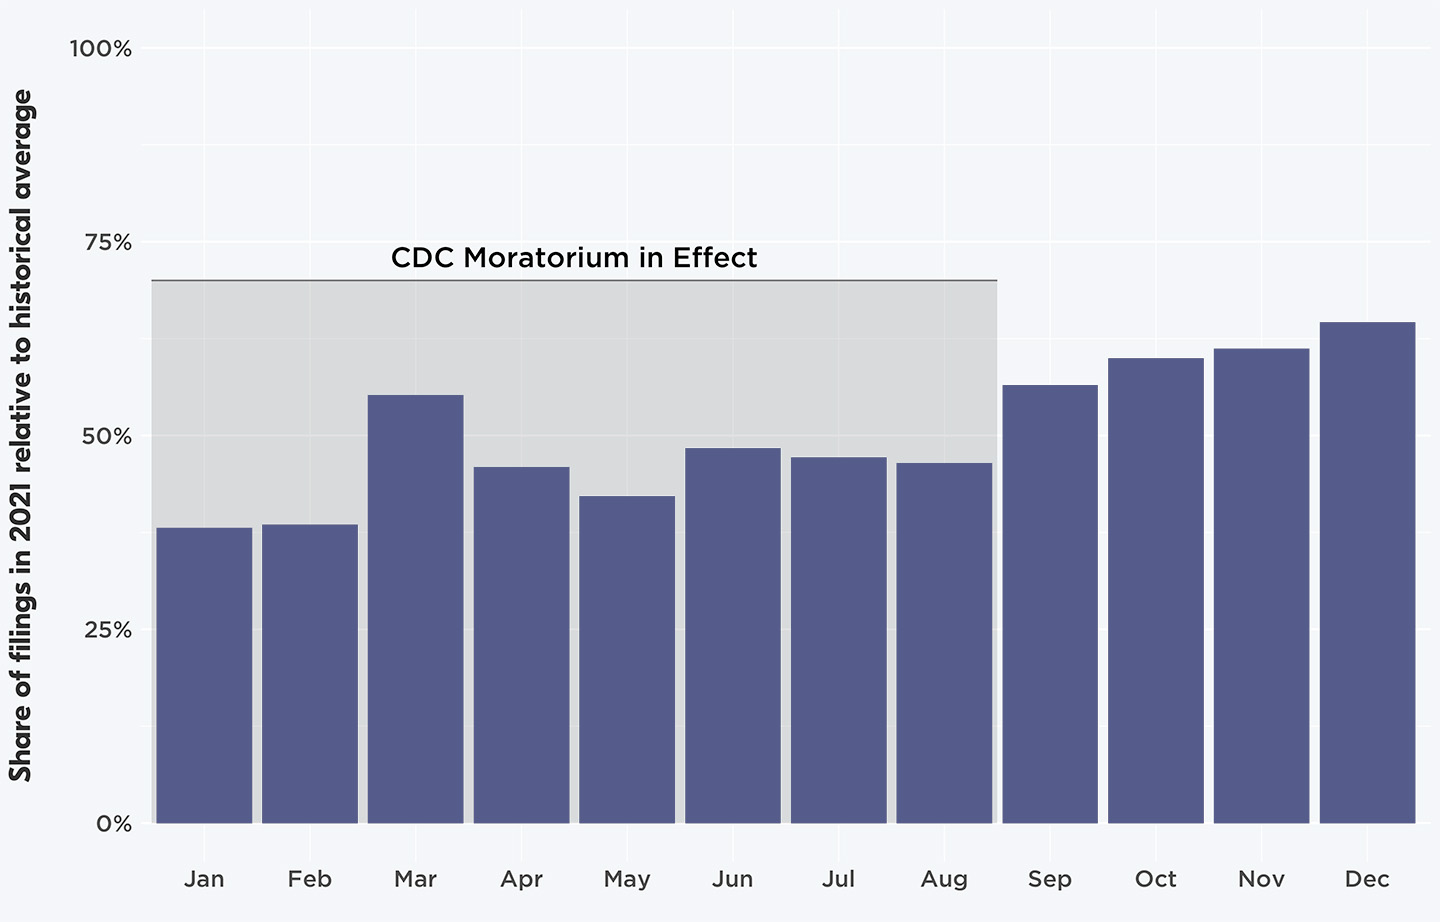
Eviction filings increased relative to typical monthly averages as 2021 progressed, but ended the year more than one-third below normal levels. In Figure 2 we plot the number of monthly eviction cases in all sites compared to historical averages. In January and February, we saw about 40% of the caseload we would expect each month, based on the same months in prior years. Filings spiked in March, but otherwise remained below 50% of historical average through the end of the summer. On August 26, the Supreme Court struck down the CDC’s federal eviction moratorium, prompting fears of a rapid spike in eviction filings. While filings did increase in the subsequent months, reaching a high of 64.6% of historical average in December, they continued to remain well below historical averages.
Across all of our sites, reductions in eviction filings were more heavily concentrated in some neighborhoods than others. Using data from the Census Bureau, we categorized every neighborhood from which we collect data by its racial/ethnic majority (Black, Latino, white, or other/none).2 In Figure 3, we plot overall reductions in eviction filings across these neighborhoods.
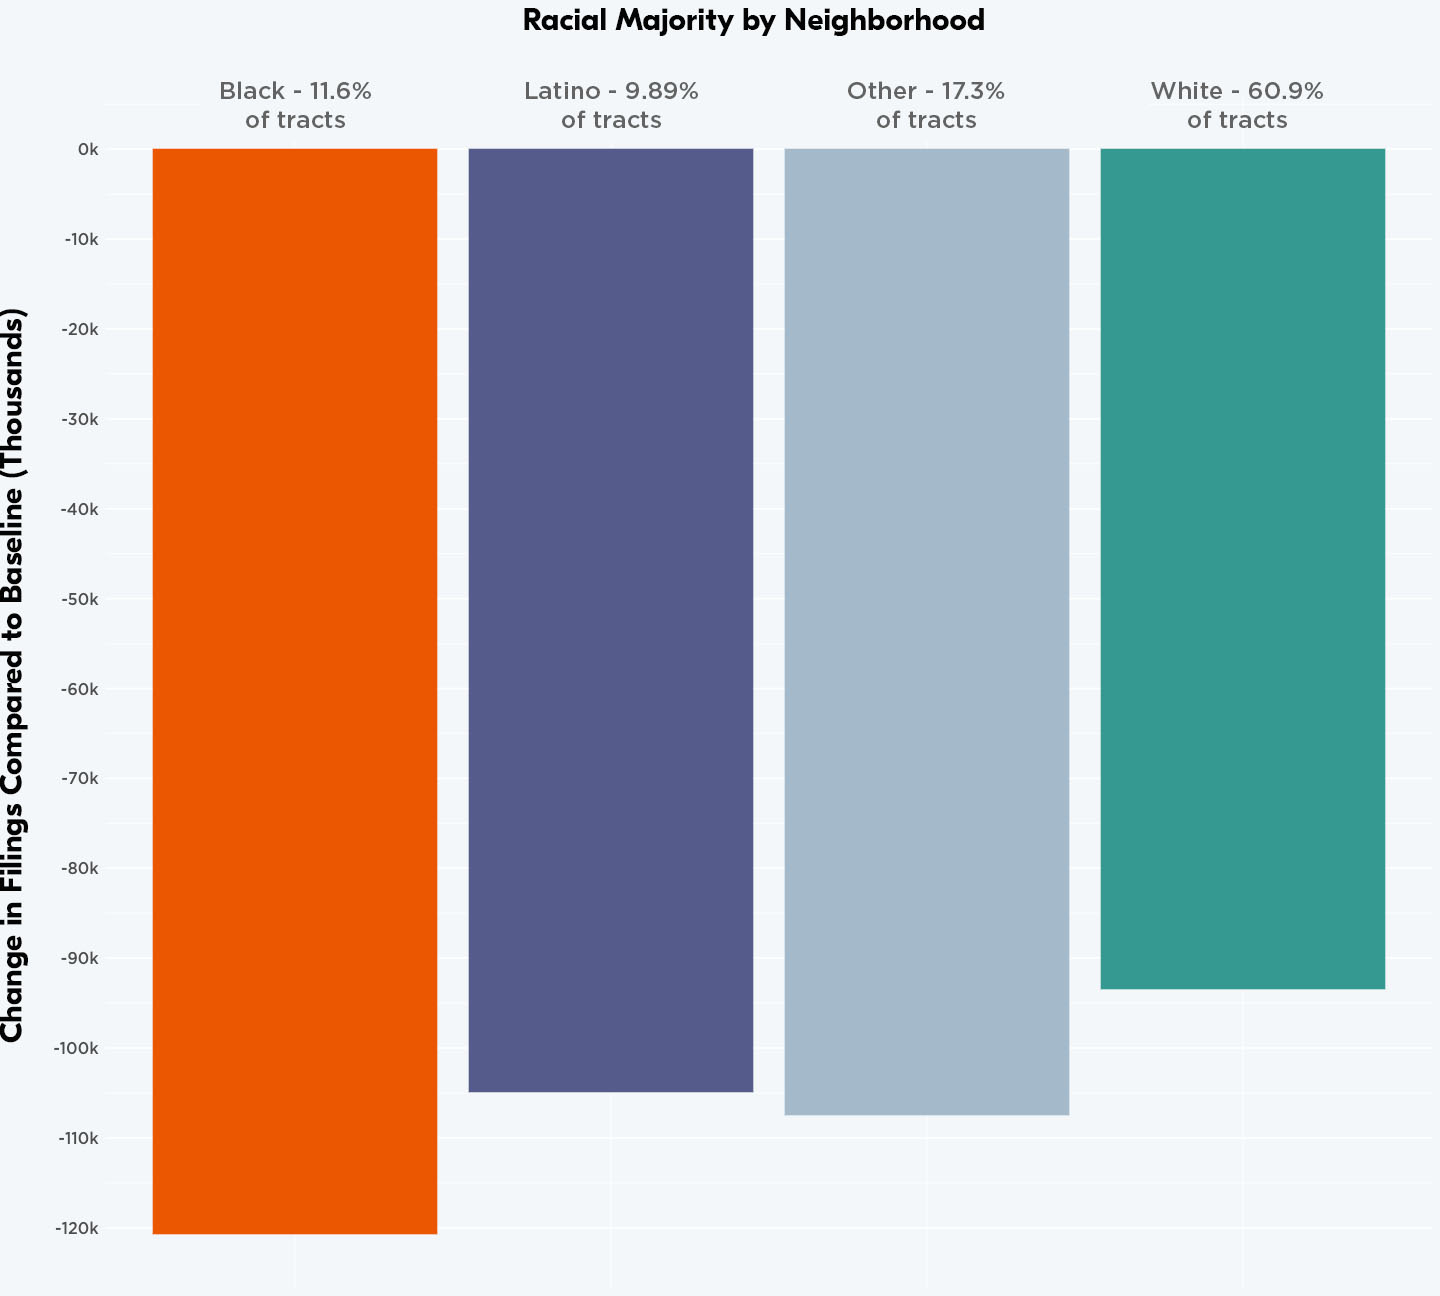
All told, we observed just over 120,000 fewer eviction filings than normal in majority-Black neighborhoods. Over a quarter (27.9%) of all avoided eviction cases in 2021 were in majority-Black neighborhoods. That’s particularly striking given that only about one in ten neighborhoods in which we collect data are classified as majority-Black (11.6%). We saw nearly 105,000 fewer eviction cases filed in 2021 in majority-Latino neighborhoods, almost 110,000 fewer in neighborhoods with no racial/ethnic majority areas, and 95,000 fewer in majority-white neighborhoods. Distribution of emergency rental assistance (ERA) may play a significant role in explaining these patterns, given that over 40% of ERA applicants identified as Black and another 20% as Latino.
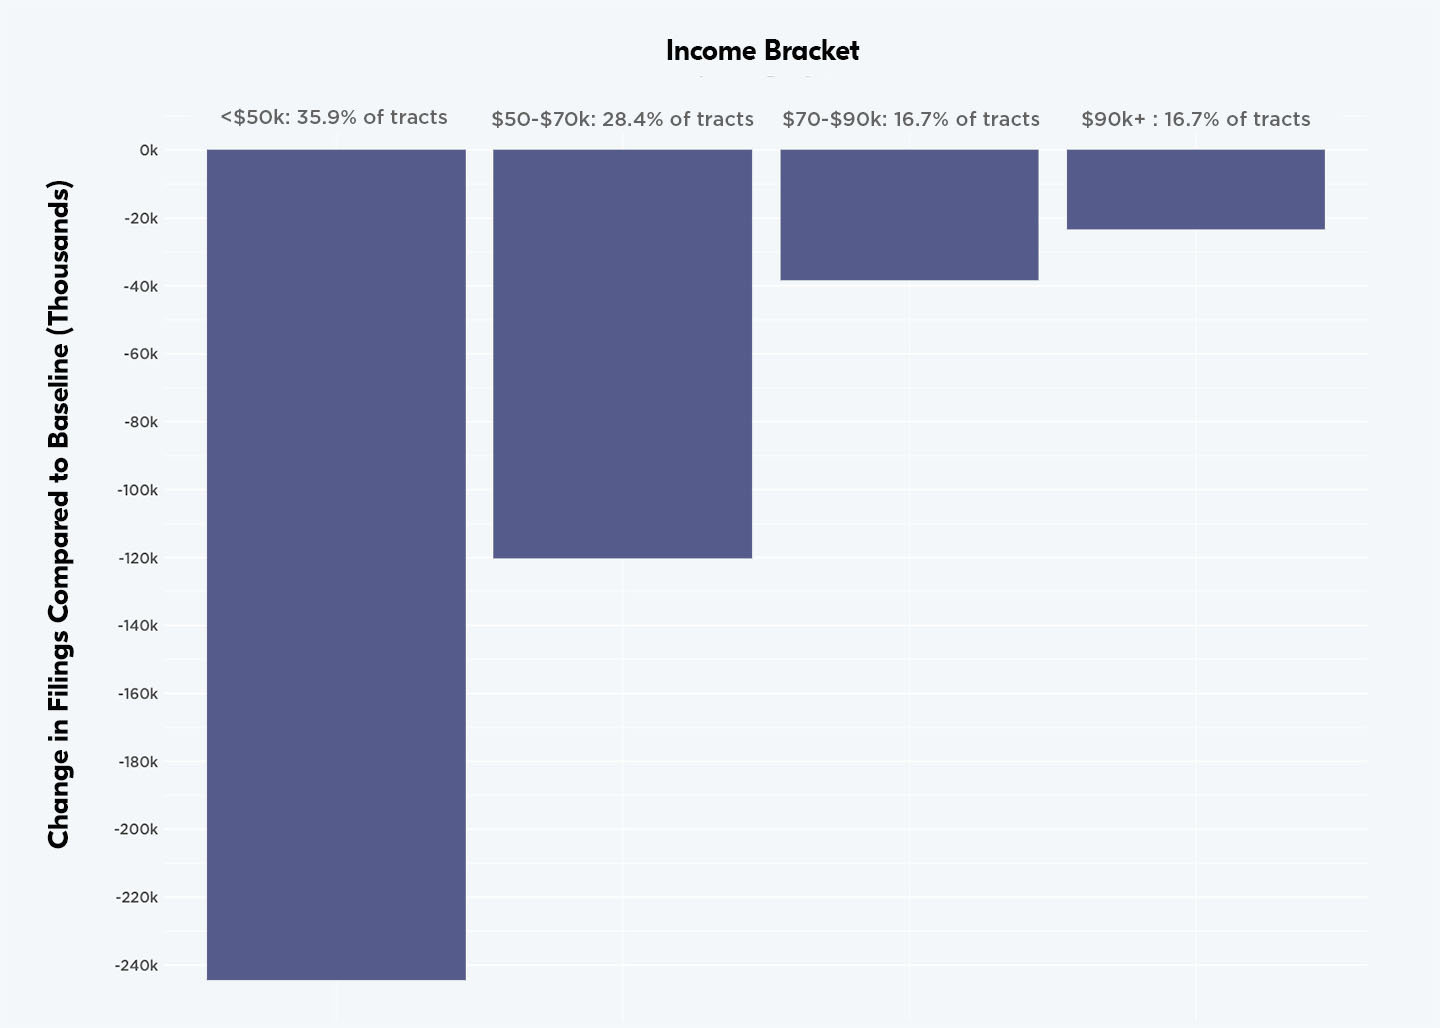
In Figure 4 we conduct a similar analysis but by socioeconomic status, using neighborhood median income. We find that the largest reductions in eviction filings were in low-income neighborhoods. Over 240,000 fewer eviction cases than normal were filed in 2021 in neighborhoods with median incomes below $50,000. Just over a third of all ETS neighborhoods fall in this category (35.9%), but they were the site of the majority of all avoided evictions (57%). Again, the targeted distribution of ERA to low-income households—over 64% of applicants reported falling below 30% of area median income—likely contributed to these patterns.
These findings indicate that in 2021 the most disadvantaged neighborhoods experienced the biggest gains in terms of rental housing stability.
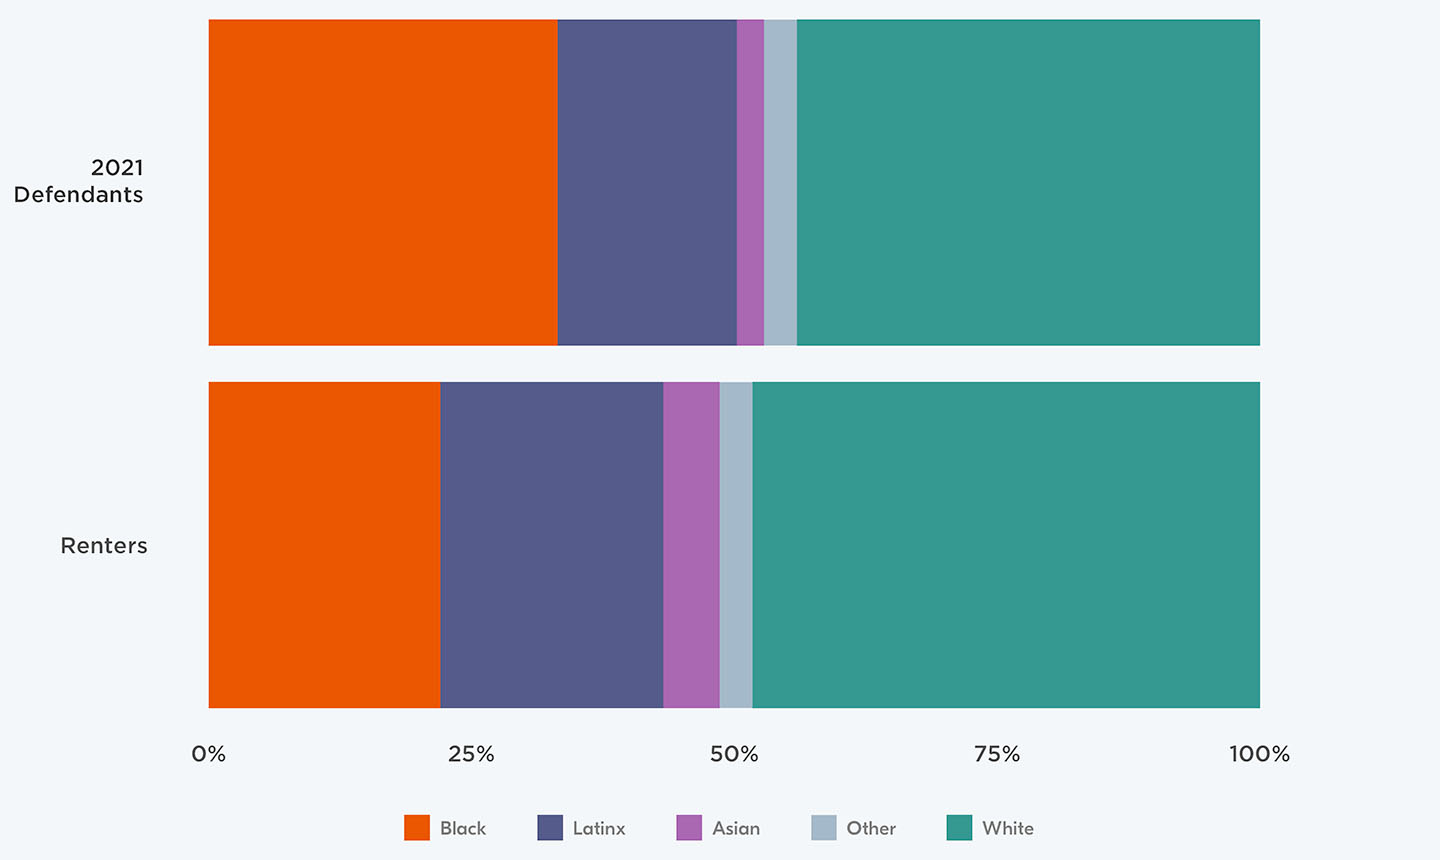
Among the eviction cases that were filed, women of color were disproportionately affected. While demographic characteristics of tenants aren’t captured in eviction filings, we used statistical techniques to predict the race/ethnicity and gender of the defendants facing eviction on the basis of available evidence.3 Of all defendants for whom we could predict gender, a slight majority were women (52.0%). Roughly one third (33.2%) of filings were against Black defendants, 17.0% against Latino defendants, and 44.0% against white defendants. As was true prior to the pandemic, Black renters—who account for only 22.0% of all renters in the areas we track—received a disproportionate share of eviction filings last year (see Figure 5).
Pandemic-related economic hardships, which were felt most acutely by renter households and those already most likely to face eviction, put millions of families at risk of losing their homes. In mid-2021, twice as many renters as normal reported being behind on rent. How is it, then, that we ended 2021 with half as many eviction filings as in a typical, pre-pandemic year? Four policy factors stand out as the most plausible explanations.
First, the Centers for Disease Control and Prevention’s eviction moratorium was in place for the first eight months of the year. The order offered protection to nearly all renter households if they filed a declaration form, and in previous analyses we estimated that at least 1.55 million fewer eviction cases than normal were filed across the U.S. while the moratorium was in force. As noted above, case filings increased after the Supreme Court struck the order down, which is suggestive of the protective effect that it had. However, eviction filings did not revert back to normal or above normal levels after the moratorium ended, indicating other factors are at play.
Second, many renters were protected by state and local eviction moratoria for some or all of 2021. In the early weeks of the pandemic, 43 states and the District of Columbia established some form of eviction moratorium. Many of these orders expired or were repealed by the end of the summer of 2020, but 16 states and the District of Columbia—home to over two million renter households living in poverty—still had a moratorium in place at the start of 2021. This set of states dwindled over time. At the end of 2021, only New Jersey, New Mexico, New York, and Washington, D.C. still had eviction moratoria in place.4
Third, an unprecedented amount of emergency rental assistance was distributed over the course of the year. Between the Consolidated Appropriations Act of 2021 and the American Rescue Plan, Congress allocated $46.5 billion in ERA funding. This money began to reach renters and landlords as early as February 2021. According to the most recent data from the Treasury Department, between $25 and $30 billion dollars was paid or obligated to over 3.8 million unique households in 2021.5 That means one in seven low-income renter households in the U.S. received rental assistance in 2021.6 Data from the Treasury Department indicate that these funds were effectively targeted to those most in need of assistance: Black and Latino tenants, women, and extremely low-income renters. More households received ERA payments over the course of 2021 (3.8 million) than receive an eviction filing in a typical year (3.7 million).
Fourth, a number of additional policies not specifically targeted to renters may have contributed to housing stability. Until early September, unemployed people could access expanded benefits including an extra $200 or $600 and more weeks of benefits. The American Rescue Plan sent a third round of stimulus payments, this time $1,400, to most Americans. And from July onwards—also as a function of the American Rescue Plan—the IRS mailed Child Tax Credit payments to millions of households, lifting many out of poverty. All three of these policies provided cash to families and may have helped them avoid eviction.
In Figure 6, we plot these policies over the course of the year. We track the number of renter households living in poverty that were protected each month by state eviction moratoria and the cumulative number of households that received ERA payments.7 We also mark out the months in which the CDC eviction moratorium was in place, when the American Rescue Plan stimulus checks were delivered, when expanded unemployment benefits were available, and when Child Tax Credit payments were sent.
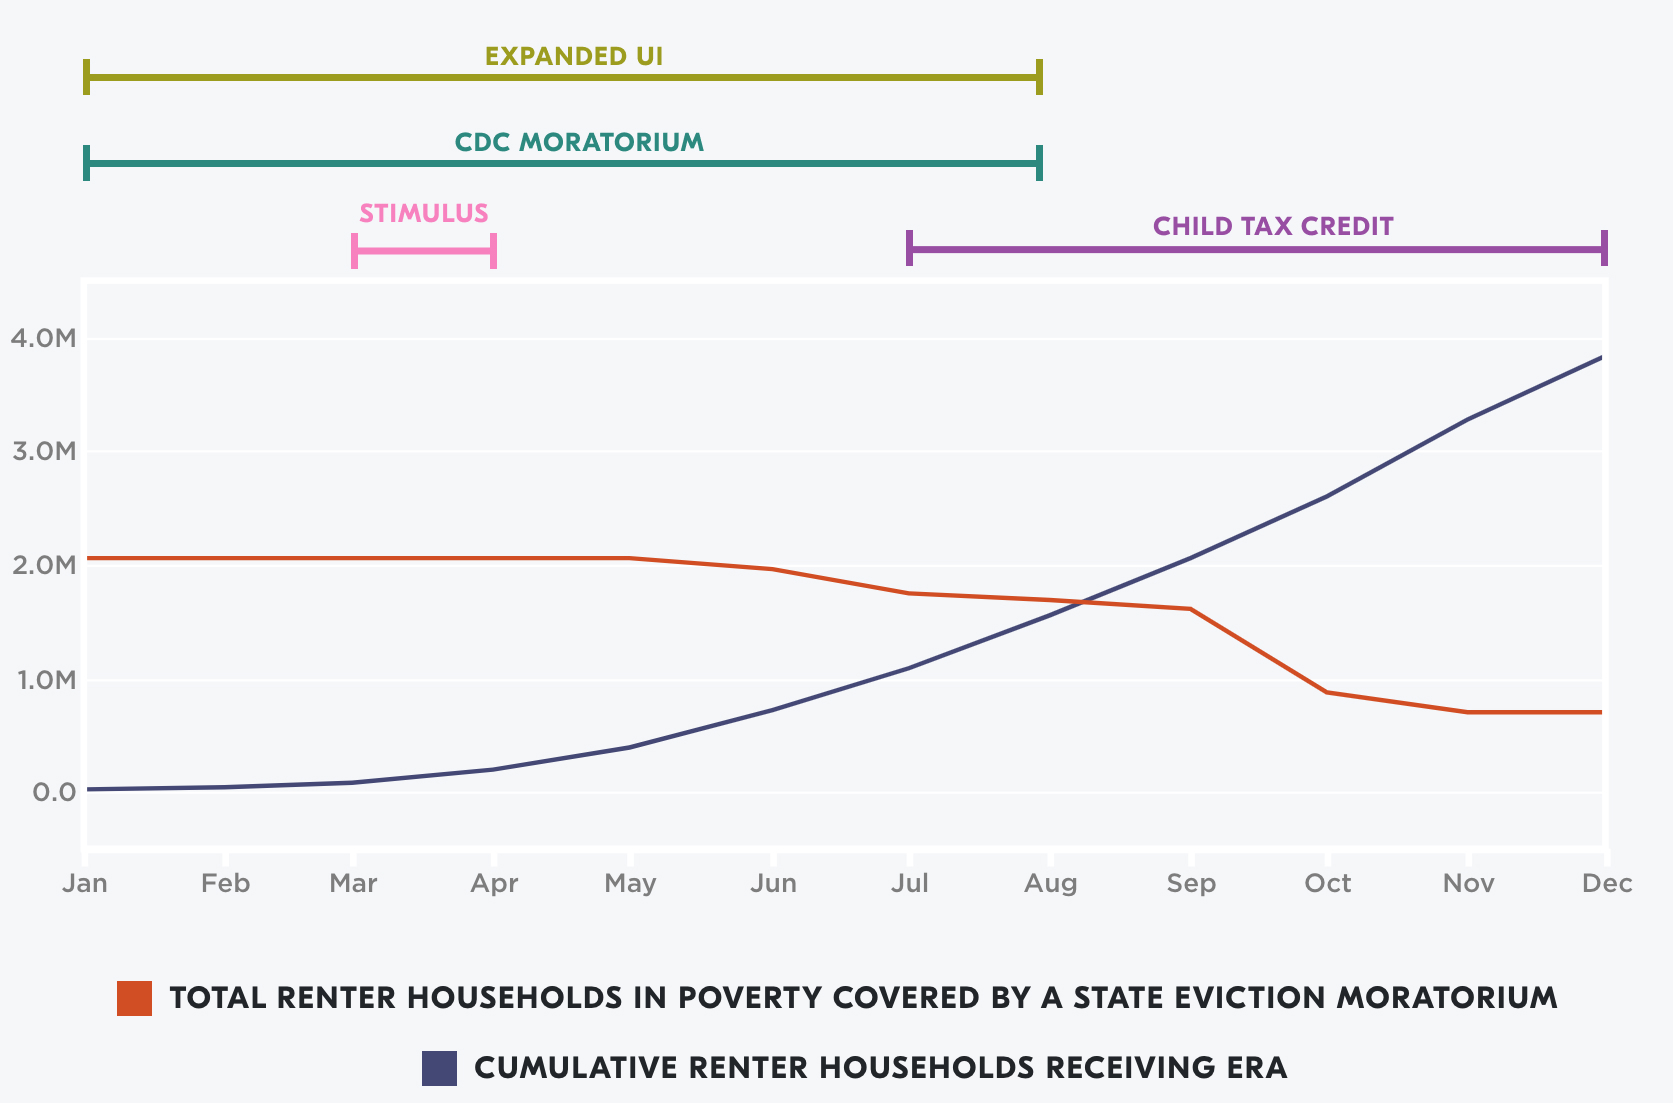
Determining exactly which policies—or what combination of policies—were most effective at driving down eviction filing rates is challenging. The overlapping nature of these supports makes causal inference difficult, but not impossible. This will be a critical area for future research to ensure that policymakers know what works best when crafting policies to keep eviction filings low and increase housing stability.
Despite the severe economic repercussions of the COVID-19 pandemic, we estimate that over three million eviction cases have been avoided nationwide between March 15, 2020 and the end of 2021. These reductions have been most pronounced in neighborhoods that normally are ground zero for the eviction crisis: majority-Black and low-income areas. It’s impossible to fully evaluate the benefits of these avoided evictions—in terms of individual, family, and community health, stability, and well-being.
The large reduction in eviction filings during the pandemic stands as evidence that the pre-existing status quo, in which 3.7 million eviction cases were filed nationwide each year, need not be taken for granted. Sustained interventions can and have dramatically reduced the level of housing instability in this country, and there’s no reason to go back to normal.