Eviction Moratoria have Prevented Over a Million Eviction Filings in the U.S. during the COVID-19 Pandemic

America faced a rental housing crisis long before the onset of the COVID-19 pandemic. In a typical, non-pandemic year, landlords would file 3.7 million eviction cases across the United States. As a result of eviction moratoria, court closures, and temporary expansions to the social safety net, far fewer eviction cases have been filed in 2020. How many fewer? And what does that tell us about the potential for a surge in eviction filings in early 2021?
Leveraging data drawn from the Eviction Tracking System (ETS), we quantify “missing” eviction filings as the difference between the number of cases that likely would have been filed in a typical year and the number that were actually filed during the pandemic. All told, we estimate that protections rolled-out during the pandemic have prevented at least 1.6 million eviction filings across the United States, cases that—in the absence of further eviction protections—may be pushed into 2021. This would create a surge in housing courts and putting an untold number of families at risk of displacement.
Focusing on the 18 cities and six states we observed in the ETS, in Figure 1 we plot total weekly eviction filings as a percentage of historical average.1 For nearly every week since the pandemic began, filings have been far below average.
Weekly eviction filings are aggregated across sites tracked by the Eviction Tracking System (ETS) as of 11/30/2020. Historical averages are calculated for the same seven-day periods in previous years. The vertical red dashed line in mid-March marks the start of the COVID-19 pandemic. The bars in orange are the two weeks between the CARES Act eviction moratorium and the CDC eviction moratorium when no federal moratorium was in effect.
Between March 15th and November 30th of a typical year, we would expect to see 520,000 eviction filings across the current ETS sites. This year we have observed 172,000 filings, or roughly one-third of normal. That leaves nearly 350,000 missing filings during the pandemic. Missing filings can be understood as a measure of the overall success of emergency eviction bans at the local, state, and federal levels, as well as CARES Act stimulus payments and unemployment expansion. The spike in evictions witnessed in August between the time the CARES Act eviction moratorium expired and the CDC moratorium went into effect (symbolized by the orange bars in Figure 1) indicate that what kept evictions lower-than-average during the pandemic was legal prohibitions on displacement.
These missing filing accrued most quickly in the early months of the pandemic. In Figure 3 we plot the cumulative number of eviction filings across all ETS sites over the course of 2020, as well as the historical average.
Prior to the start of the pandemic, eviction filings in 2020 across all ETS sites were almost exactly on pace with the historical average: about 50,000 cases filed each month. Between March and the end of July—when the CARES Act was in place and all sites were, for at least some time, under state or local eviction moratoria—new filings fell to an average of 2,100 per month, or 4.2% of the normal rate.
Since the start of September—with the CDC eviction moratorium in place, but with more state and local eviction moratoria expired—this rose to over 7,000 cases filed per month. While this rate remains significantly below historical average, it is nonetheless over triple the rate of new filings observed when the CARES Act and the local and state moratoria were at their strongest. Strict moratoria reduced eviction filings dramatically. As protections have been weakened, more cases have been filed.
The share of missing eviction filings varies considerably across cities and states covered by the ETS. We explore this variation in Figure 4, plotting the percentage of expected cases that have been filed (the blue bar) and the percentage of missing filings (the red bar). The number in white is the absolute number of missing filings.
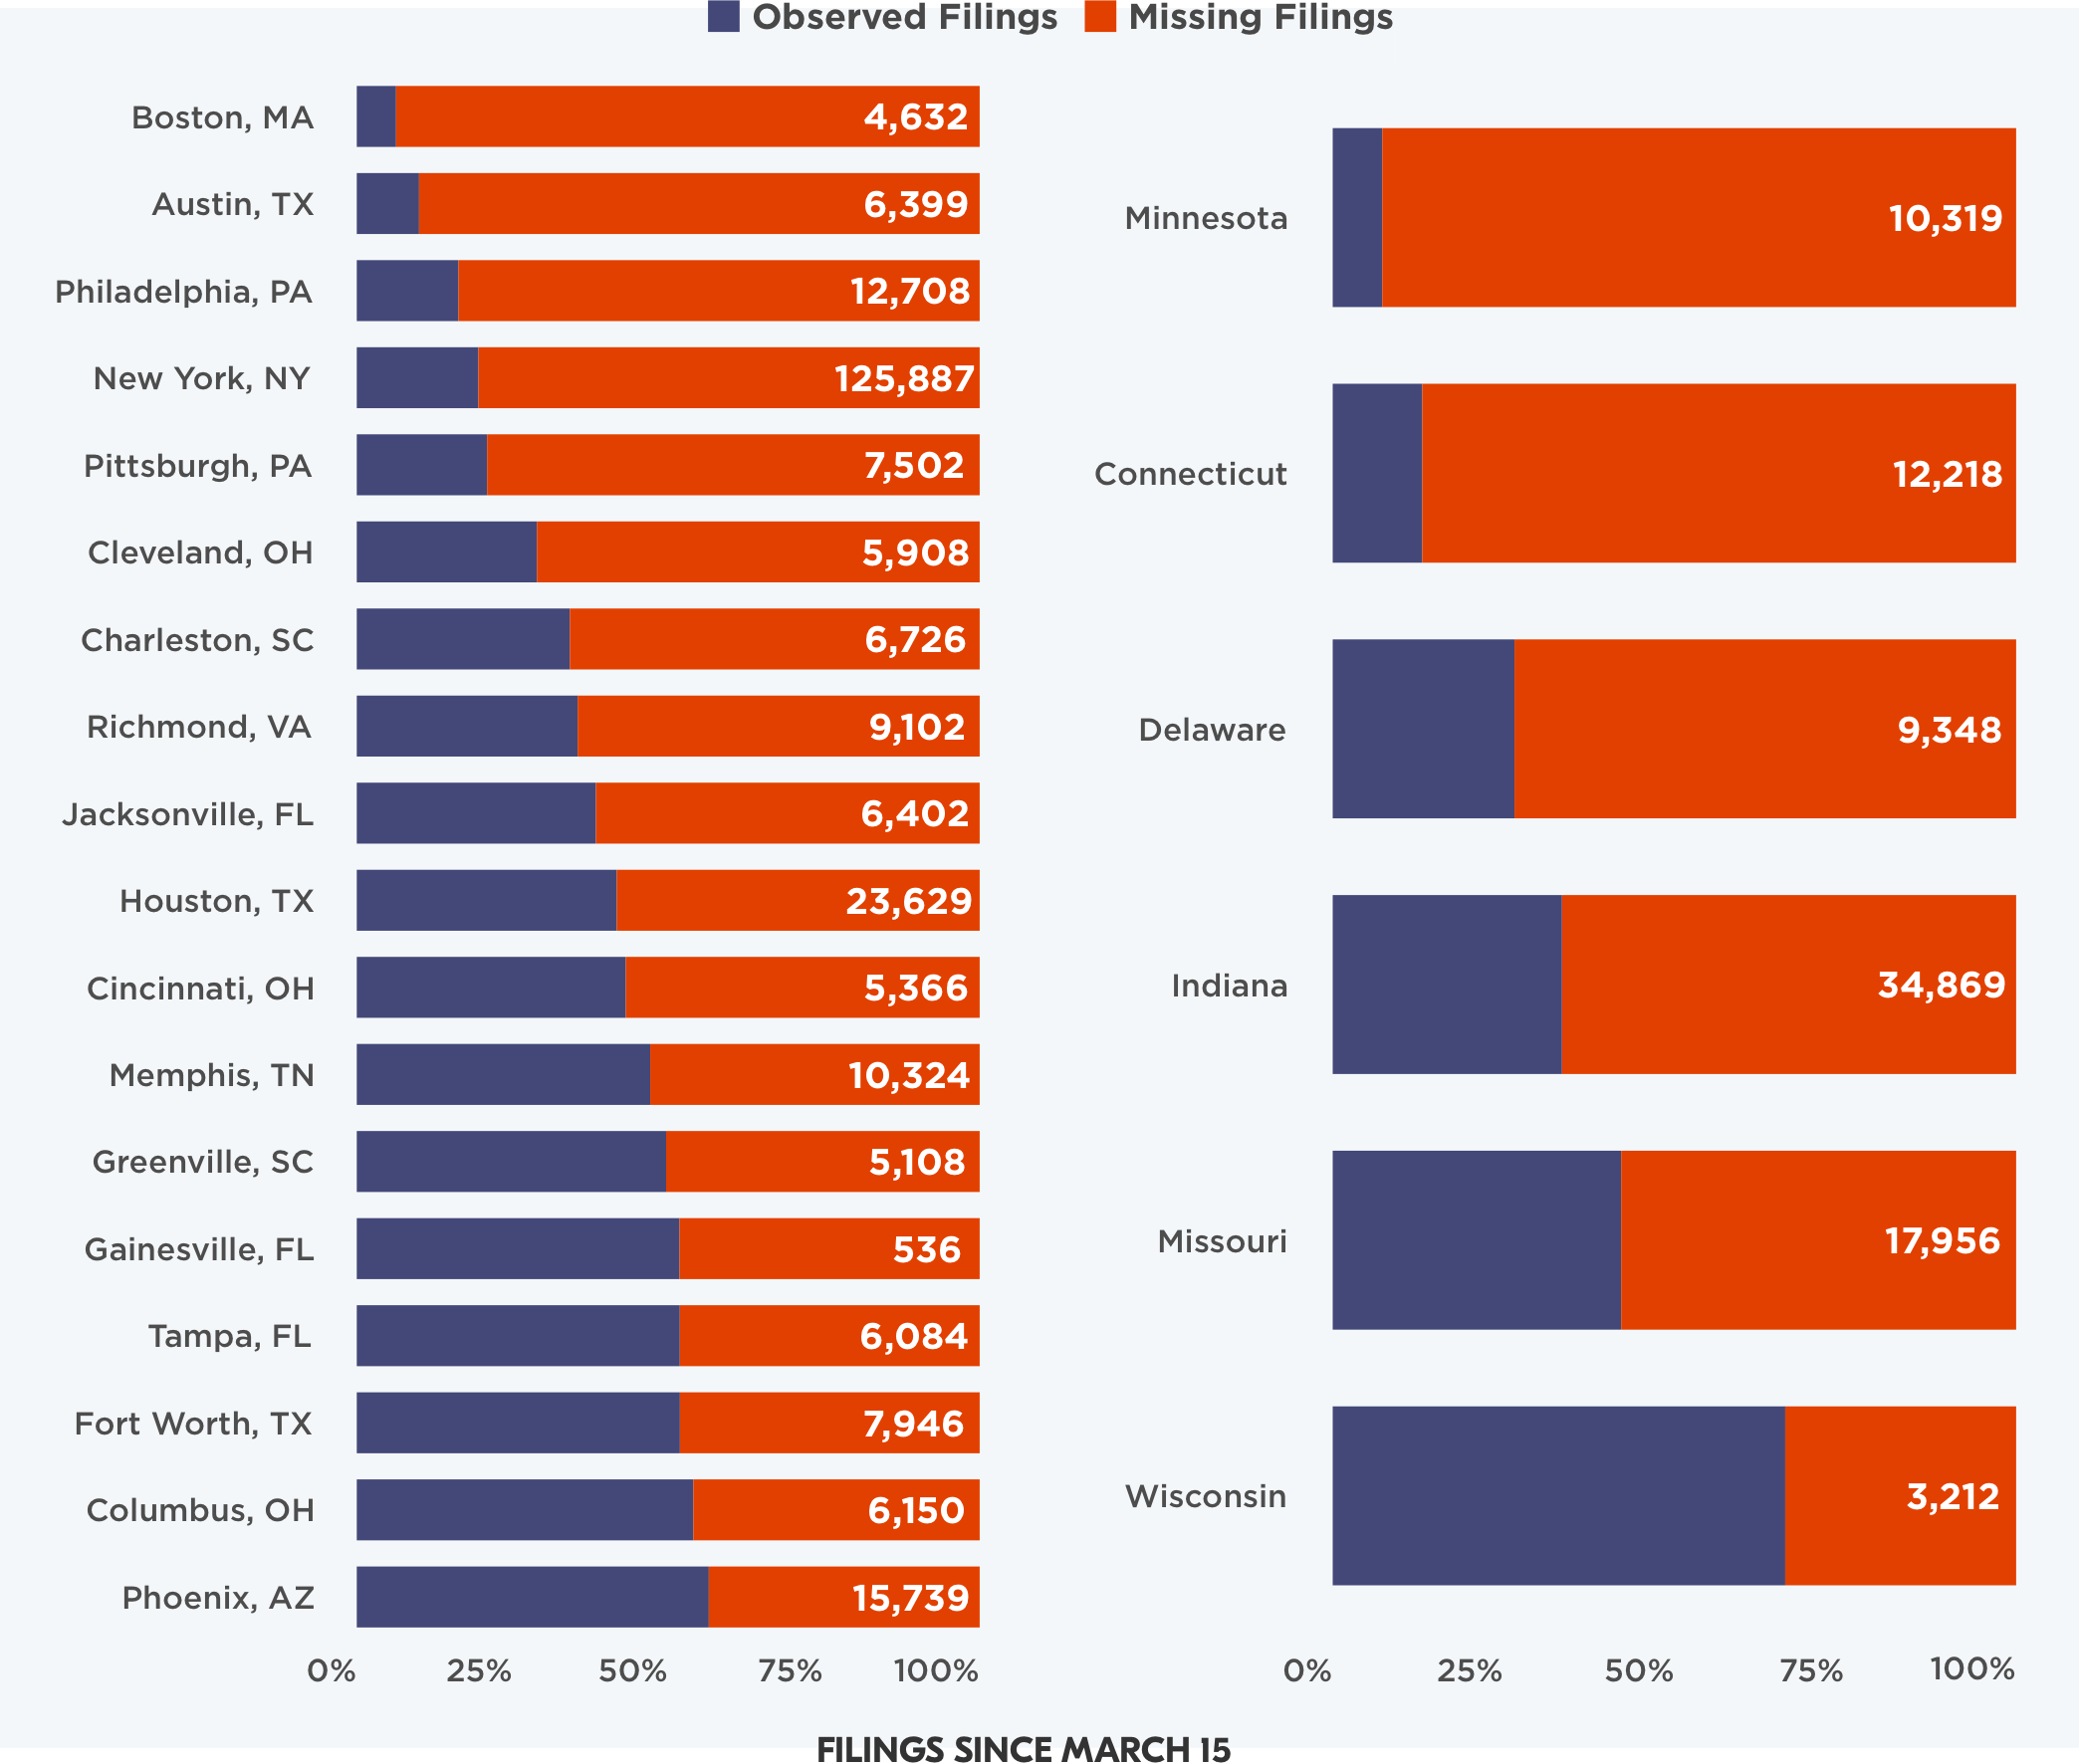
Some cities and states have far more successfully reduced eviction filings than others. Jurisdictions in the cities in our sample have enacted a wide variety of protections for renters during the pandemic. Some of these measures were extremely effective in reducing eviction filings. For example, in Boston—subject to Massachusetts’s statewide eviction moratorium between April 20th and October 17th—eviction filings since March 15th were at less than 10% of historical average. Houston, by contrast, was subject to a much shorter eviction moratorium that did allow for new filings. In that city, we observed nearly half the number of normal filings.
The differences in states’ success in reducing eviction filings is even more striking. Minnesota has had a statewide eviction moratorium in place since March 16th; only 10% of normal cases have been filed. Neighboring Wisconsin ended their moratorium on May 26th and has seen almost 60% of normal filings since the start of the pandemic.
ETS data collection covers 18 cities and six full states, home to one in every four renter households in the United States. Housing markets and socio-demographic composition of ETS areas resemble those of the United States as a whole (see Appendix Table). The majority of renting households are, however, absent from our calculations of missing eviction filings. To provide a national estimate of the total number of missing eviction filings during the COVID-19, pandemic we turn to regression analysis, extrapolating what we observed in the ETS to all other counties for which we have historical eviction filing data.2 This allows us to cover an additional 27.5 million renter households, bringing overall coverage to 38.5 million out of 43 million renter households (89.5%).
Extrapolating to the rest of the nation from the 18 cities and 6 states in our sample requires significant assumptions. We estimate that there have been 800,000 eviction filings across all non-ETS counties between March 15th and November 30th.3 In a typical year over this period, these counties would have experienced over 2.1 million eviction filings, thus leaving 1.3 million missing filings. Across the country, as many as 1.6 million eviction cases may be missing from 2020—and potentially pushed to early 2021.
On January 1, 2021, when the CDC eviction moratorium expires, renters will have the fewest protections available to them since the start of the COVID-19 pandemic. At the time of writing, only eight states have moratoria that are scheduled to extend into the new year.4 Eviction moratoriums were effective at lowering the rate of eviction filings during the pandemic. However, eviction filings are rising as we approach the end of the year, and tenants facing the threat of eviction appear to be falling further behind on rent.
| ETS | U.S. | |||
| Estimate | SD | Estimate | SD | |
| Number of Renter HHs | 11,076,250 | 17,124 | 43,669,988 | 21,378 |
| Median Rental Housing Age | 64.5 | 167 | 49.6 | 86.1 |
| Median Rent ($) | 1105 | 293 | 1,076 | 317 |
| Percent Children Renting HH | 30.20% | 0.09% | 32.80% | 0.03% |
| Percent Female Renting HH | 18.80% | 0.05% | 19.00% | 0.03% |
| Poverty Rate | 24.50% | 0.01% | 25.60% | 0.00% |
| Vacancy Rate | 10.80% | 0.03% | 11.10% | 0.01% |
| Renting Householder Head Race | ||||
| Black | 22.30% | 0.05% | 19.70% | 0.02% |
| Latinx | 14.80% | 0.04% | 19.80% | 0.02% |
| Other | 6.70% | 0.00% | 7.80% | 0.05% |
| White | 56.10% | 0.06% | 52.60% | 0.02% |
Note: With the exception of the first row, all estimates are means. Means for median rent and rental housing age were calculated using a weighted mean, weighted by number of renting households for the county level. Standard deviations were calculated using the margin of error provided by the Census Bureau for the American Community Survey.